Experimental Typst web edition · Veto chapter pilot
4 Computational Framework
4.1 Scope and software contributions of this thesis
The background and veto studies require a traceable calculation from an incident particle to a reconstructed detector event. This chapter describes the software developed or extended in this thesis to support that calculation: particle generation, radiation transport, detector response, readout mapping, reconstruction, and large-scale production. Auxiliary tools for visualization and data acquisition provide checks on the same event and geometry representations.
The distinction between pre-existing infrastructure and thesis-specific contributions is important for understanding the role of each component. REST-for-Physics [83], Geant4 [84–86], ROOT [87], CRY [88], and the Kotlin GDML domain-specific language were already available when this work began. The contributions of this thesis lie in integrating these tools into a reproducible end-to-end simulation and analysis workflow, adding new generators and analysis processes, developing auxiliary tools for validation and monitoring, and scaling the production to the throughput required for an IAXO background model. Table 4.1 and Table 4.2 summarize the main software components and their role in the thesis.
| Component | Problem | Thesis contribution | Validation or output |
|---|---|---|---|
REST-for-Physics model | Reproducible, version-tracked analysis chains for rare-event searches | Used framework as common analysis language for IAXO; configured RML chains, validated EventTree/AnalysisTree workflow | analysis.rml chain used for all productions; consistency checks vs. experimental data |
restG4 + Geant4Lib | Performance, storage, multi-threading, and flexibility of Geant4 simulations | Multi-threading, track pruning, sub-event splitting, interrupt handling, volume hash resolution | Framework-wide development histories exceeding 600 and 370 commits, respectively; 1–10 storage reduction; validated with cosmic productions |
| Micromegas/veto readout | From electronics channels to physically meaningful detector observables | Generated TRestDetectorReadout for IAXO-D0/D1 strips and 59-panel veto; validated against geometry | Channel-ID audit tools; cross-check of simulation readout vs. experimental readout |
| Geometry integration | Reproducible IAXO geometries for shielding/veto scans | Integrated Kotlin GDML DSL into restG4, resolved hashed volume names, validated readout consistency | Production geometries linked to simulation files via Git commit |
| Track pruning | Large output files from full-track storage | Configurable volume-of-interest pruning preserving tracks leading to relevant detector deposits | 1–10 output reduction; validation runs checked the veto/TPC observables used in the analysis |
| PDP cosmic generator | Inefficient cosmic secondary generation wasting CPU on non-detector trajectories | Published Probability Distribution Projection method; samples directly from trajectories intersecting enclosing sphere | Peer-reviewed [89]; 3–37 yield improvement |
CRY-to-REST source histograms | Reusable atmospheric-secondary source terms for many geometries | Developed auxiliary generator that runs CRY, extracts particle-dependent – distributions, and stores them as ROOT histograms | Cross-checked against EXPACS, HENSA, and detector-level cosmic productions |
HTCondor production | Manual job management for large campaigns | Developed restG4ToCondor.py with DAGMan, merging, output staging, and dry-run support | Initial 300-job campaigns; validation productions totaling about 40 000 final events across 600 Condor jobs, followed by the larger campaigns reported in Section 6 |
| Component | Problem | Thesis contribution | Validation or output |
|---|---|---|---|
Uproot + fsspec | Python ROOT-file I/O limited to local files and a few remote protocols | Delegated all Uproot I/O to fsspec, enabling SSH, cloud, and other compatible protocols without protocol-specific code | Upstreamed to Uproot v5.2.0; enabled feminos-viewer remote support |
| Browser event viewer | No portable tool for event topology, veto-hit patterns, geometry inspection | Developed web viewer using three.js; converts TRestGeant4Event to JSON; exports figures | Used to debug geometry, validate veto mapping, produce thesis figures |
feminos-daq / viewer | Legacy mclient lacked live monitoring and ROOT output | Refactored DAQ: ROOT output, Prometheus monitoring, CMake build, live Python waveform viewer | Used during IAXO-D0/D1 operation for real-time diagnostics |
hvps | Vendor-specific serial protocols made high-voltage monitoring difficult to integrate into slow control | Developed Python package, command-line interface, CAEN/iseg backends, and Node.js/Node-RED bindings | Published on PyPI/npm; unit-tested command generation; GUI prototype for CAEN N1471H supplies |
geant4-python-application | Standard Geant4 workflows are C++-application based, limiting notebook prototyping | Pybind11 wrapper with process isolation; pip-installable wheels on PyPI | Attenuation-length notebooks; not used for production simulations |
4.2 The ROOT Data Analysis Framework and Python interoperability
ROOT [87] is the data analysis framework developed by CERN and the foundation on which REST-for-Physics is built. For this thesis, the most relevant features of ROOT are its file format (.root), its TTree columnar storage, its Python bindings (PyROOT), and the serialization dictionary system that REST-for-Physics relies on for metadata persistence and versioning.
The principal 2026 NAF production stack used ROOT v6.34.04. Earlier experimental processing and the compression benchmark described below used other versions; the relevant version therefore belongs to the individual production or analysis record. The ROOT file format remains the primary data container for both Monte Carlo and experimental data within the IAXO collaboration. Every restG4 simulation, every restManager processing step, and every DAQ acquisition file uses the same underlying storage format, which is essential for maintaining a single analysis language across the full chain.
While ROOT provides extensive built-in visualization and analysis tools, most of the figures in this thesis were produced with Python libraries such as Matplotlib and Plotly. This was possible thanks to two developments: ROOT’s own PyROOT interface, which exposes C++ objects to Python, and Uproot [90], a pure-Python library that reads and writes ROOT files without requiring a ROOT installation.
4.2.1 Uproot and fsspec integration
Uproot is widely used for reading ROOT files in Python and underpins many Python-based HEP analysis workflows. A three-month IRIS-HEP fellowship during this thesis provided the opportunity to contribute to Uproot directly. At the time, Uproot supported local files and a few remote protocols (HTTP, XRootD), each requiring a hand-written implementation inside the library. The fellowship work delegated all file-I/O operations in Uproot to fsspec, a Python library that provides a uniform interface across local and remote file systems. This change, released in Uproot v5.2.0, simplified the codebase and made every fsspec-compatible protocol (including SSH, cloud object stores, and WebDAV) available to Uproot without additional maintenance burden.
This integration was directly useful for the present thesis in two ways. First, it enabled the feminos-viewer application to open remote DAQ files over SSH while they are being written, using the same code path as local files. Second, it allowed the Python-based background-analysis scripts to read simulation outputs directly from the NAF-IAXO dCache storage without copying them locally. The experience also provided a thorough understanding of the ROOT file format, which was important for designing the DAQ ROOT output and for debugging file-structure issues during analysis.
4.3 REST-for-Physics as the common event-processing framework
REST-for-Physics [83] (Rare Event Searches Toolkit for Physics) is an open-source, collaborative C++/ROOT-based framework that provides a unified environment for data acquisition, Monte Carlo simulation, detector-response emulation, and physics analysis. It was originally developed for experiments searching for rare phenomena such as neutrino interactions, dark matter, and axion signals, where precise detector modeling and reproducible analysis chains are essential.
The same architecture was used for the IAXO pathfinder detector at CAST, as documented in the thesis of Cristina Margalejo Blasco [80]. This provides a relevant application of the transport, response, and reconstruction workflow to a low-background Micromegas detector.
REST-for-Physics is structured as a core Git repository with libraries and packages as Git submodules. It is strongly rooted in the ROOT ecosystem and follows ROOT conventions for class naming, I/O patterns, and dictionary-based serialization. The framework exposes three main executables: restG4, a user-configurable Geant4 application initialized via RML configuration files; restManager, which applies a sequence of processing stages to data; and restRoot, a ROOT interpreter wrapper that loads the REST-for-Physics environment for interactive data inspection.
4.3.1 Event-based processing and the EventTree/AnalysisTree model
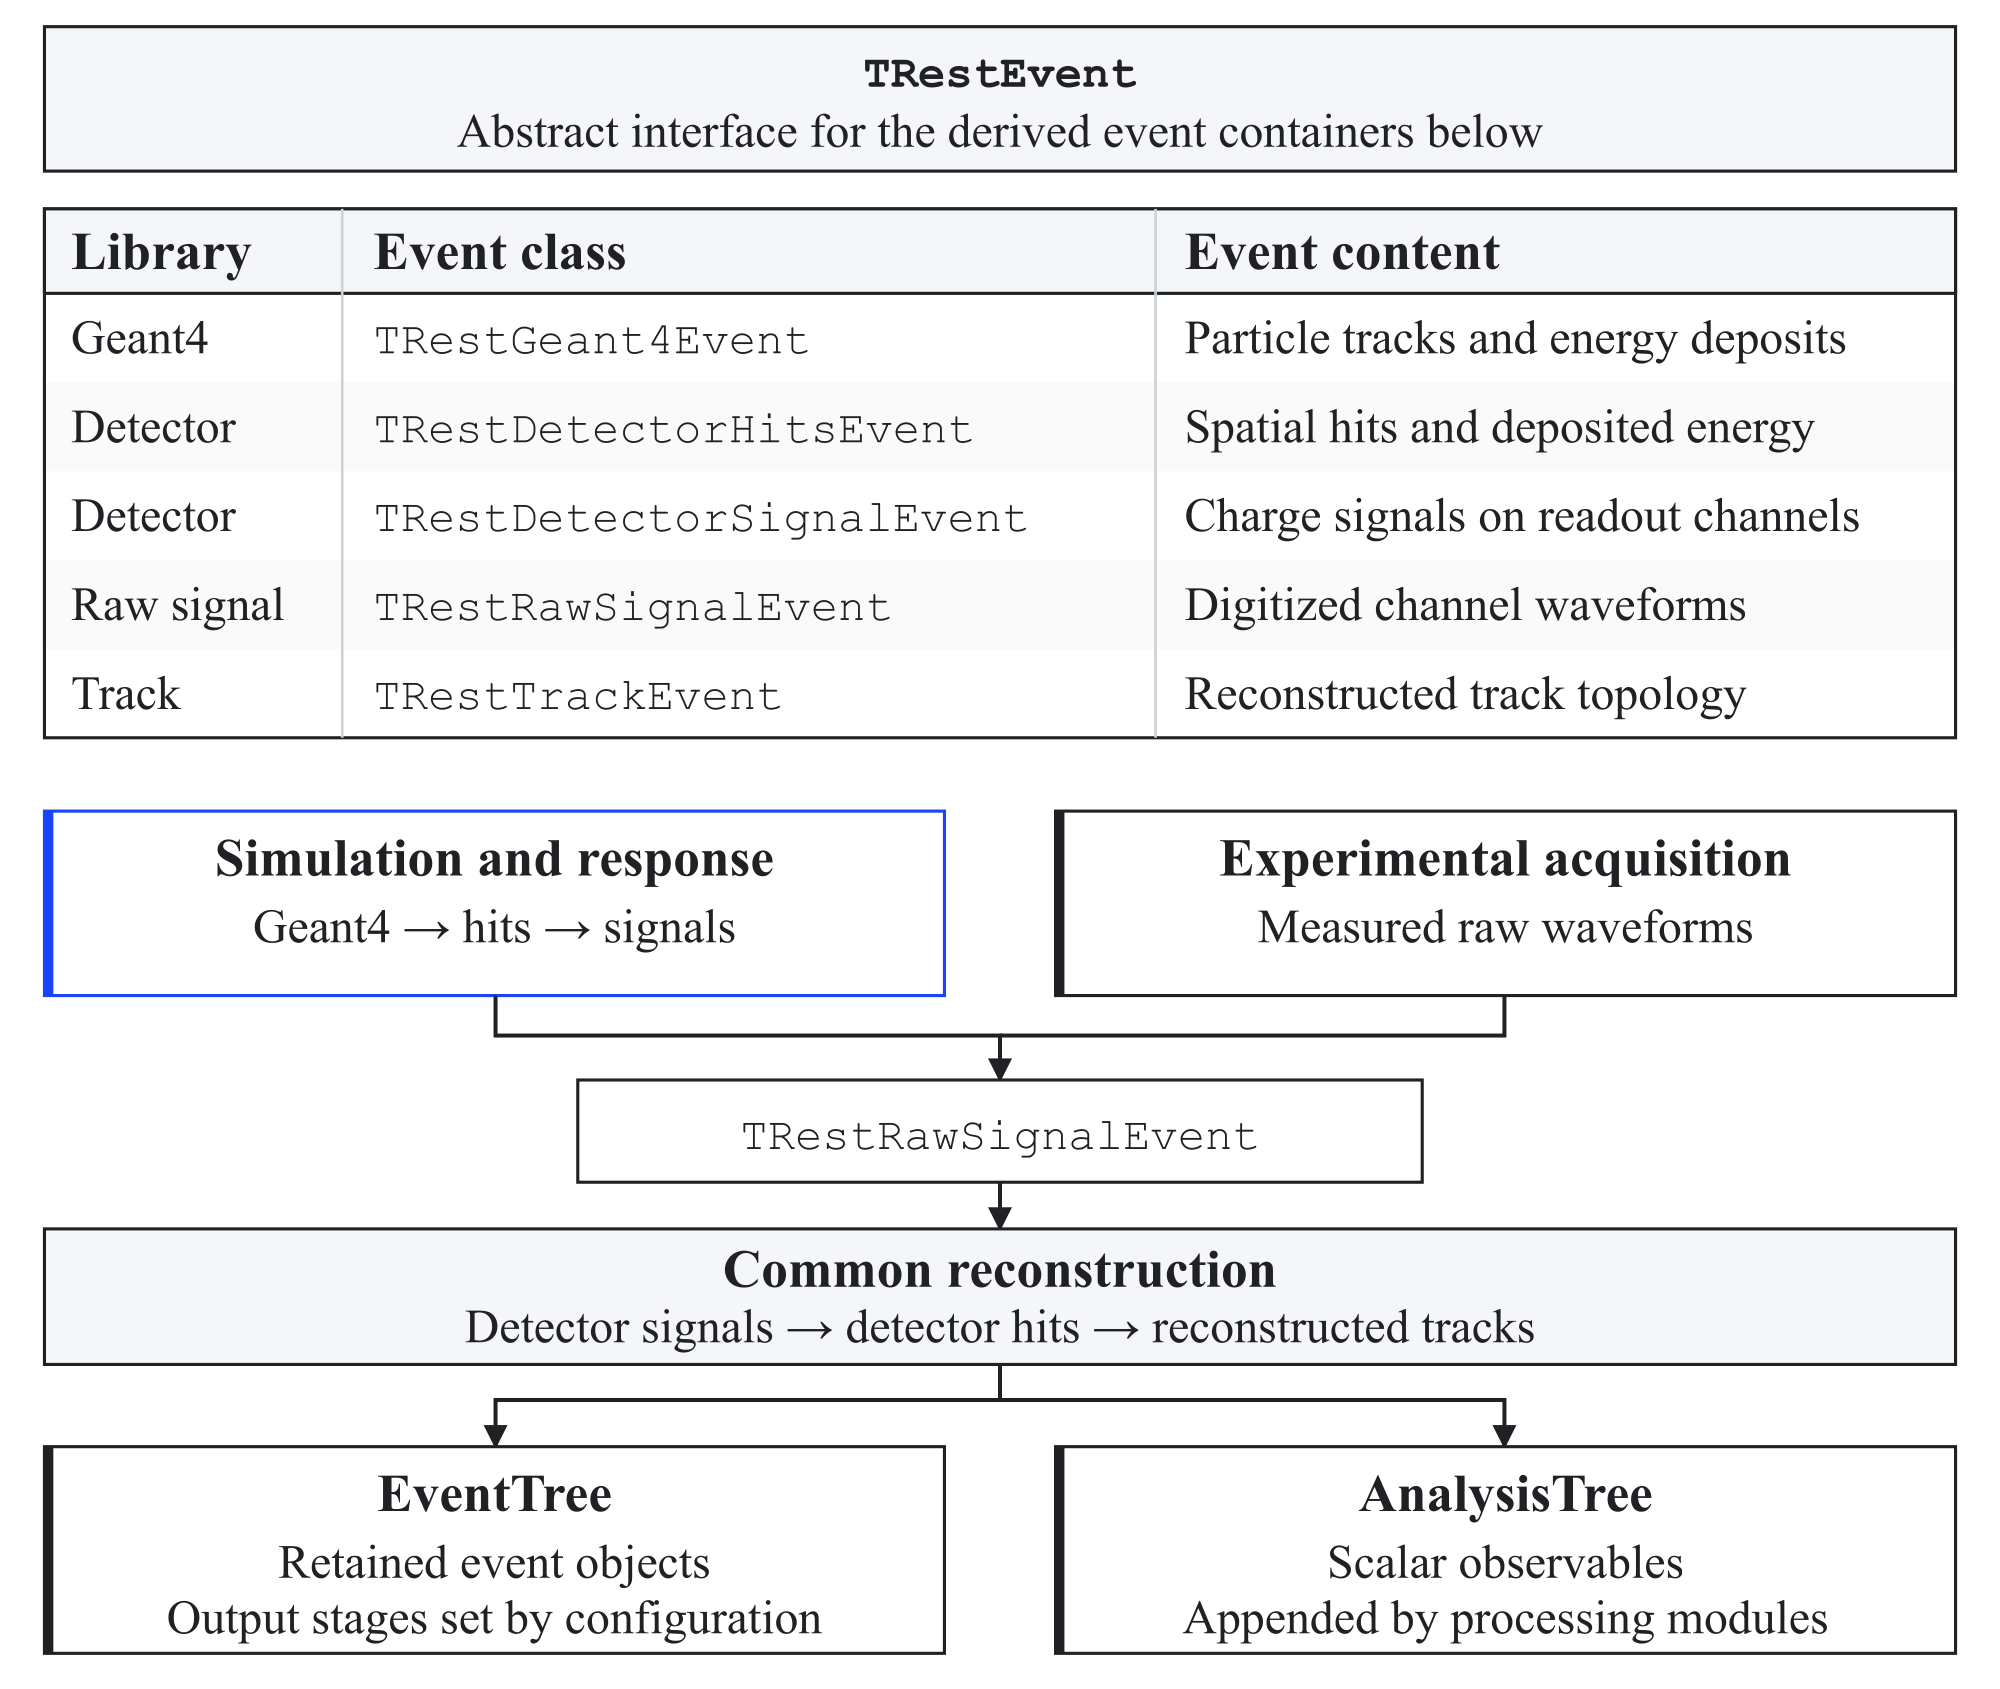
REST-for-Physics. Simulated detector response and measured waveforms converge on a common TRestRawSignalEvent representation before following the same reconstruction chain. Different processing stages operate on TRestEvent-derived containers and may append observables to the AnalysisTree while preserving the corresponding event representation in the EventTree.REST-for-Physics follows an event-driven architecture. The abstract TRestEvent class is the central data container, with libraries defining their own derived event types (e.g. TRestGeant4Event, TRestRawSignalEvent, TRestTrackEvent). Each library also provides processes that transform one event type into another or compute scalar observables.
Data persistence is organized around two complementary TTree structures. The EventTree stores the event representation selected for output. An output containing reconstructed tracks does not necessarily retain the earlier transport hits or waveforms; those stages must be saved separately if later response reprocessing is required. The AnalysisTree, implemented as TRestAnalysisTree, stores scalar observables computed by the different processes and is used for cuts, control plots, efficiency studies, and background estimates. This separation is especially valuable in rare-event searches, where thresholds and selections are often scanned many times without regenerating the complete event representation.
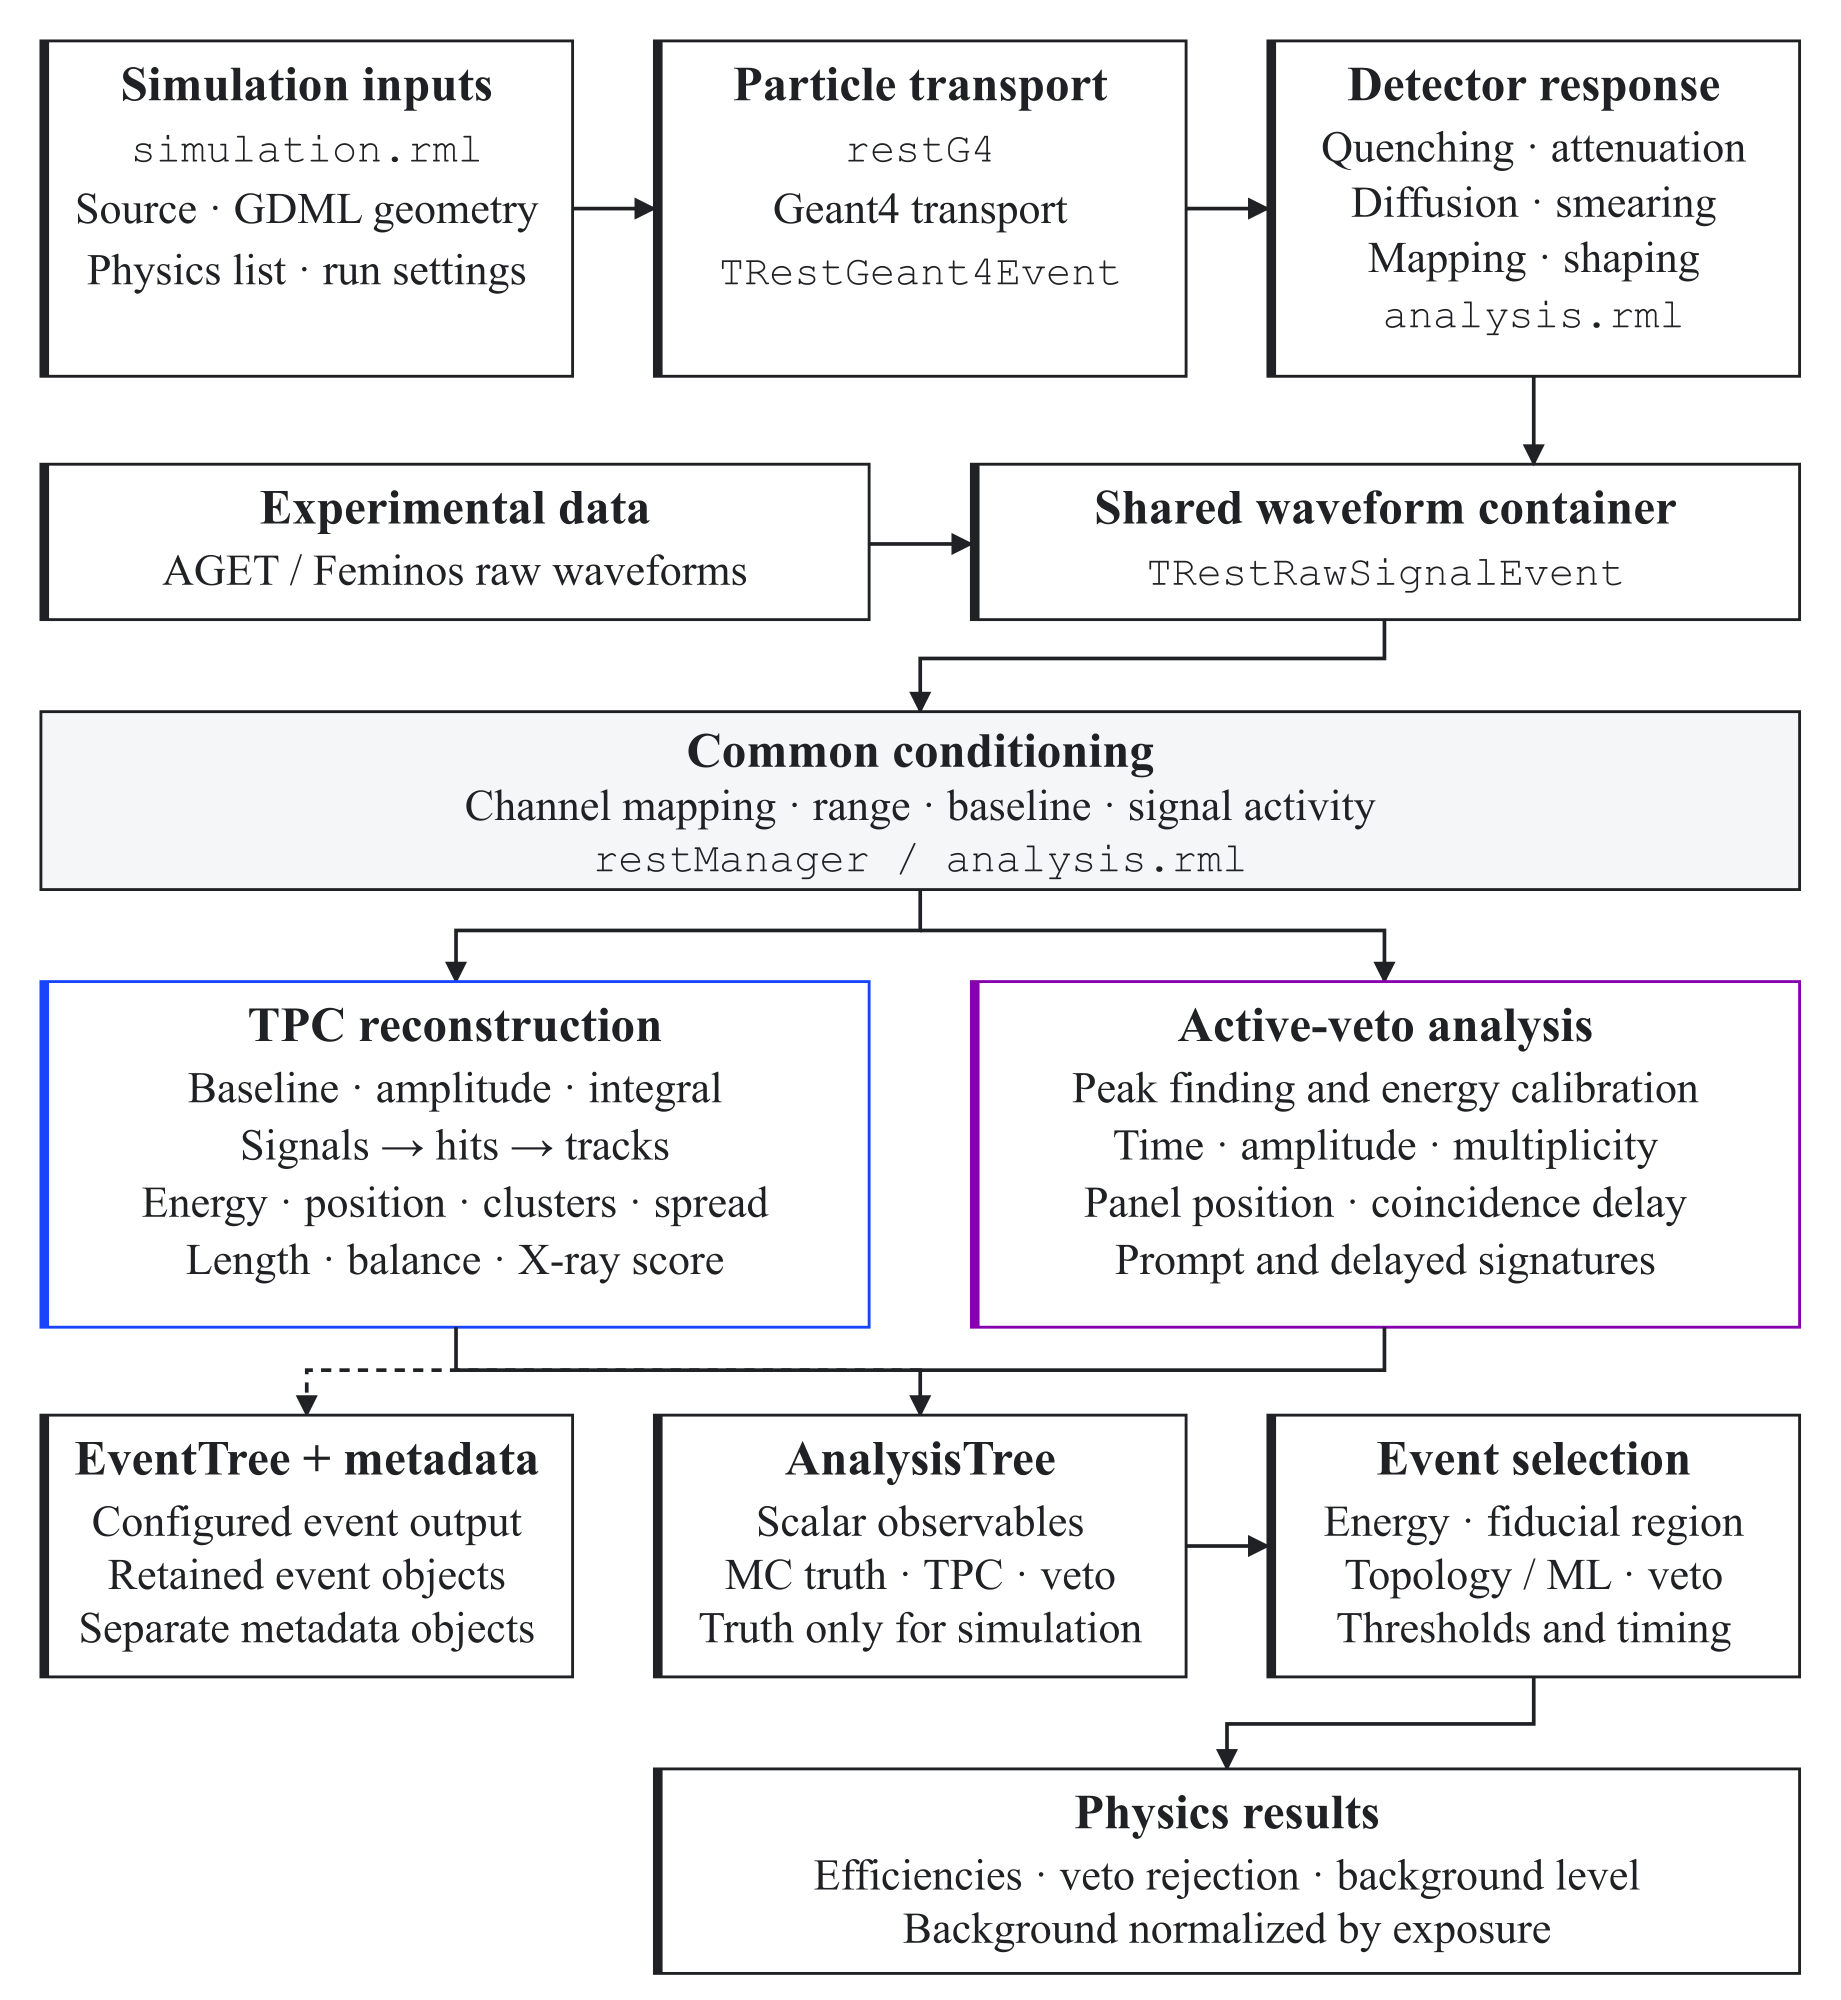
REST-for-Physics analysis workflow used in this thesis. Source-specific simulation and geometry inputs are transported with restG4; detector-response emulation then produces the same TRestRawSignalEvent representation supplied by experimental AGET/Feminos data. Common conditioning feeds the TPC reconstruction and active-veto peak-analysis branches, whose observables are stored in the AnalysisTree and used for event selection, veto-rejection estimates, and exposure-normalized background levels. The selected event representation and processing metadata are stored in the EventTree and serialized metadata objects.For the IAXO Micromegas studies, a common analysis.rml chain transformed Geant4 truth information into Micromegas and veto observables that could be treated with the same logic used for measured data. In the TPC branch this meant deriving reconstructed hit and track observables for X-ray/background discrimination. In the veto branch it meant emulating waveforms and applying peak finding to obtain timing, amplitude, and multiplicity observables. This architecture permits selections on reconstructed quantities, with transport truth retained separately for mechanism studies. A common reconstruction algorithm does not itself establish agreement between simulated and measured detector response; that comparison is part of the validation in Section 5 and Section 6.
The AnalysisTree approach also provides a systematic way of turning reconstruction outputs into reusable analysis products. Observables filled by each process can be inspected interactively, processed through ROOT macros or Python scripts, or consumed by dedicated REST-for-Physics plotting utilities. In this thesis many final figures were produced with external tools, while their underlying observables were derived from the REST-for-Physics reconstruction chain. The analysis identifier specifies which branch definitions, calibration, and selections apply to each product.
4.3.2 Reproducibility and maintainability
REST-for-Physics stores the full analysis configuration as metadata objects inside the ROOT file, including framework version, dependency versions, and RML parameters. These objects support provenance inspection and reanalysis of the event representation actually retained in the file. Reconstruction cannot be replayed from an earlier stage whose hits or waveforms were discarded. The source code is version-controlled and openly available on GitHub; periodic releases specify recommended versions of ROOT, Geant4, and Garfield++ to simplify reproducibility. Container images with pre-built dependencies are provided for users who want a consistent environment, and a comprehensive test suite with Google Test runs in GitHub Actions CI for every pull request. The CI infrastructure was migrated from GitLab to GitHub Actions during this work. For production provenance, a nominal release or repository commit is insufficient when local patches, staged configurations, or gas tables differ from that revision. Table 4.3 lists the records needed to identify those inputs. The background-model chapter distinguishes recovered campaign records from historical products whose normalization or response cannot yet be reconstructed completely.
| Item | Stored or recorded in | Purpose |
|---|---|---|
REST-for-Physics revision and local patches | ROOT metadata, build record, and patch hashes | Identifies event classes, response algorithms, and metadata conventions. |
ROOT, Geant4, and Garfield++ versions | Environment metadata, release notes, and container configuration | Fixes the external software stack used for transport, I/O, and gas-parameter generation. |
| Geometry repository commit | Simulation metadata and iaxo-geometry repository | Links each production to a specific GDML geometry and veto/shielding configuration. |
| RML and physics-data inputs | Staged-file hashes, serialized metadata, and data-library versions | Records source support, physics constructors, region cuts, response, and reconstruction settings. |
| Random seeds and job identifiers | HTCondor logs and job outputs | Allows failed jobs to be diagnosed and statistically independent campaigns to be checked. |
| Source histograms and gas tables | Input-file hashes and generation commands | Records source units, bin and angular measures, energy support, and gas-transport parameters. |
| Generated-parent and exposure ledger | Per-file counters, source integrals, and accepted file list | Connects selected events to physical exposure without substituting saved events for generated trials. |
HTCondor logs and DAG identifiers | Batch-system output directories and merge logs | Documents job splitting, runtime, failures, restarts, output staging, and merge history. |
Final output metadata and AnalysisTree | Merged ROOT files | Preserves the observables used for cuts, efficiency studies, and background-rate calculations. |
4.4 Detector readout metadata and channel mapping
An essential intermediate layer between transport simulation and physics analysis is the detector readout description encoded in the TRestDetectorReadout metadata classes. In plain terms, this layer translates electronics channel numbers into physical detector positions and types, making it possible to know whether a signal came from a Micromegas strip, a veto scintillator panel, or a specific region of the detector. Without it, a waveform would remain only a list of ADC samples attached to an integer channel number. With it, the same processing chain can move consistently from raw signals to detector signals, and from detector signals to reconstructed hits and tracks, while preserving the physical interpretation of each channel. The readout description is organized hierarchically. TRestDetectorReadout stores the full detector readout as a collection of TRestDetectorReadoutPlane objects. Each plane defines a position and orientation in world coordinates, the normal vector that identifies the drift side, the effective height of the active volume, and a semantic type such as tpc or veto. Each plane contains TRestDetectorReadoutModule objects, which define the local geometry of a readout module. Inside each module, TRestDetectorReadoutChannel stores the correspondence between the DAQ identifier and the physical channel identifier, while TRestDetectorReadoutPixel provides the elementary polygons representing the actual sensitive pattern. A physical channel may be composed of many pixels combined into a complex strip or pad geometry, which is important for the microbulk Micromegas pattern, where each strip is constructed from multiple pixels including the special edge pieces required by the real detector layout.
For the veto system, the effort was even more detector-specific. The scintillator panels do not form a single regular plane but a distributed system of individually oriented detector elements surrounding the shielding. Dedicated readout-generation code was developed to build one TRestDetectorReadoutPlane per veto panel, using the geometry information to determine the panel position, its outward normal, and the corresponding effective sensitive depth. Each panel was assigned a unique channel identifier and an alias matching the experimental naming convention. This mapping step was essential because the later analysis is formulated in terms of physical veto groups, layers, and aliases rather than arbitrary DAQ integers.
This metadata layer bridges the simulation-side and data-side representations of the detector response. On the simulation side, processes such as TRestDetectorHitsToSignalProcess use the readout geometry to decide which channels collect charge or light from a given interaction point. On the experimental side, TRestRawToDetectorSignalProcess and TRestDetectorSignalToHitsProcess use the same readout definition to transform digitized waveforms back into detector signals and then into reconstructed spatial hits. The auxiliary TRestRawReadoutMetadataProcess serializes channel-level information so that later waveform-analysis stages can distinguish TPC channels from veto channels without relying on external spreadsheets.
This was one of the most consequential software contributions of this thesis because it gave the Micromegas and veto branches a common event-level representation. That capability becomes especially important in the signal-analysis chapters, where waveform observables, strip topology, and veto coincidences must be combined in a single event-level selection strategy.
![Figure 4.3: Schematic view of the readout-metadata layer used in this thesis, combining the event-and-metadata philosophy of REST-for-Physics [ 83 ] with the IAXO-specific Micromegas and veto readout definitions. The upper panel connects the physical detector elements to the hierarchical TRestDetectorReadout geometry-to-channel map. The lower part shows how simulated-hit mapping and experimental waveform decoding use the shared channel metadata. Pixel geometry supports TPC spatial-hit reconstruction, while readout-linked veto waveforms supply peak-time, panel, and coincidence observables.](assets/f59c8e35b83d52ded6c3771c.png)
REST-for-Physics [83] with the IAXO-specific Micromegas and veto readout definitions. The upper panel connects the physical detector elements to the hierarchical TRestDetectorReadout geometry-to-channel map. The lower part shows how simulated-hit mapping and experimental waveform decoding use the shared channel metadata. Pixel geometry supports TPC spatial-hit reconstruction, while readout-linked veto waveforms supply peak-time, panel, and coincidence observables.4.5 Data-driven raw-signal emulation
Matching a reconstructed peak does not ensure that simulated and measured Micromegas waveforms present the same input to the reconstruction. Measured traces also contain baseline fluctuations, coherent low-frequency structure, channel correlations, and occasional excursions near the signal region. These features can change threshold crossings and peak multiplicity and therefore cannot be added after reconstruction.
An additive residual model was developed to reduce the discrepancy between simulated and measured calibration-waveform distributions:
(4.1)
where is the TPC channel index and is the digitizer sample. The residual term is produced by a convolutional generative adversarial network (GAN) trained on separate batches of simulated and measured calibration traces. There are no event-by-event paired residual targets. Penalties on pulse modification, channel correlations, and spectral structure constrain the generated correction, but do not uniquely identify it with electronics noise: it can also absorb discrepancies in gain, shaping, diffusion, or calibration. Residuals are generated over the full channel–time array, including the signal region, because measured structure can affect low-amplitude channels near threshold.
Figure 4.4 separates fixed run conditions, the limited spectral tuning needed to align the calibration peak, and the learned residual component. Gas composition, field, readout, shaping, and sampling follow the experimental configuration. Only the energy calibration and additional resolution term are tuned at spectrum level; the residual bank supplies an empirical correction at the waveform level.
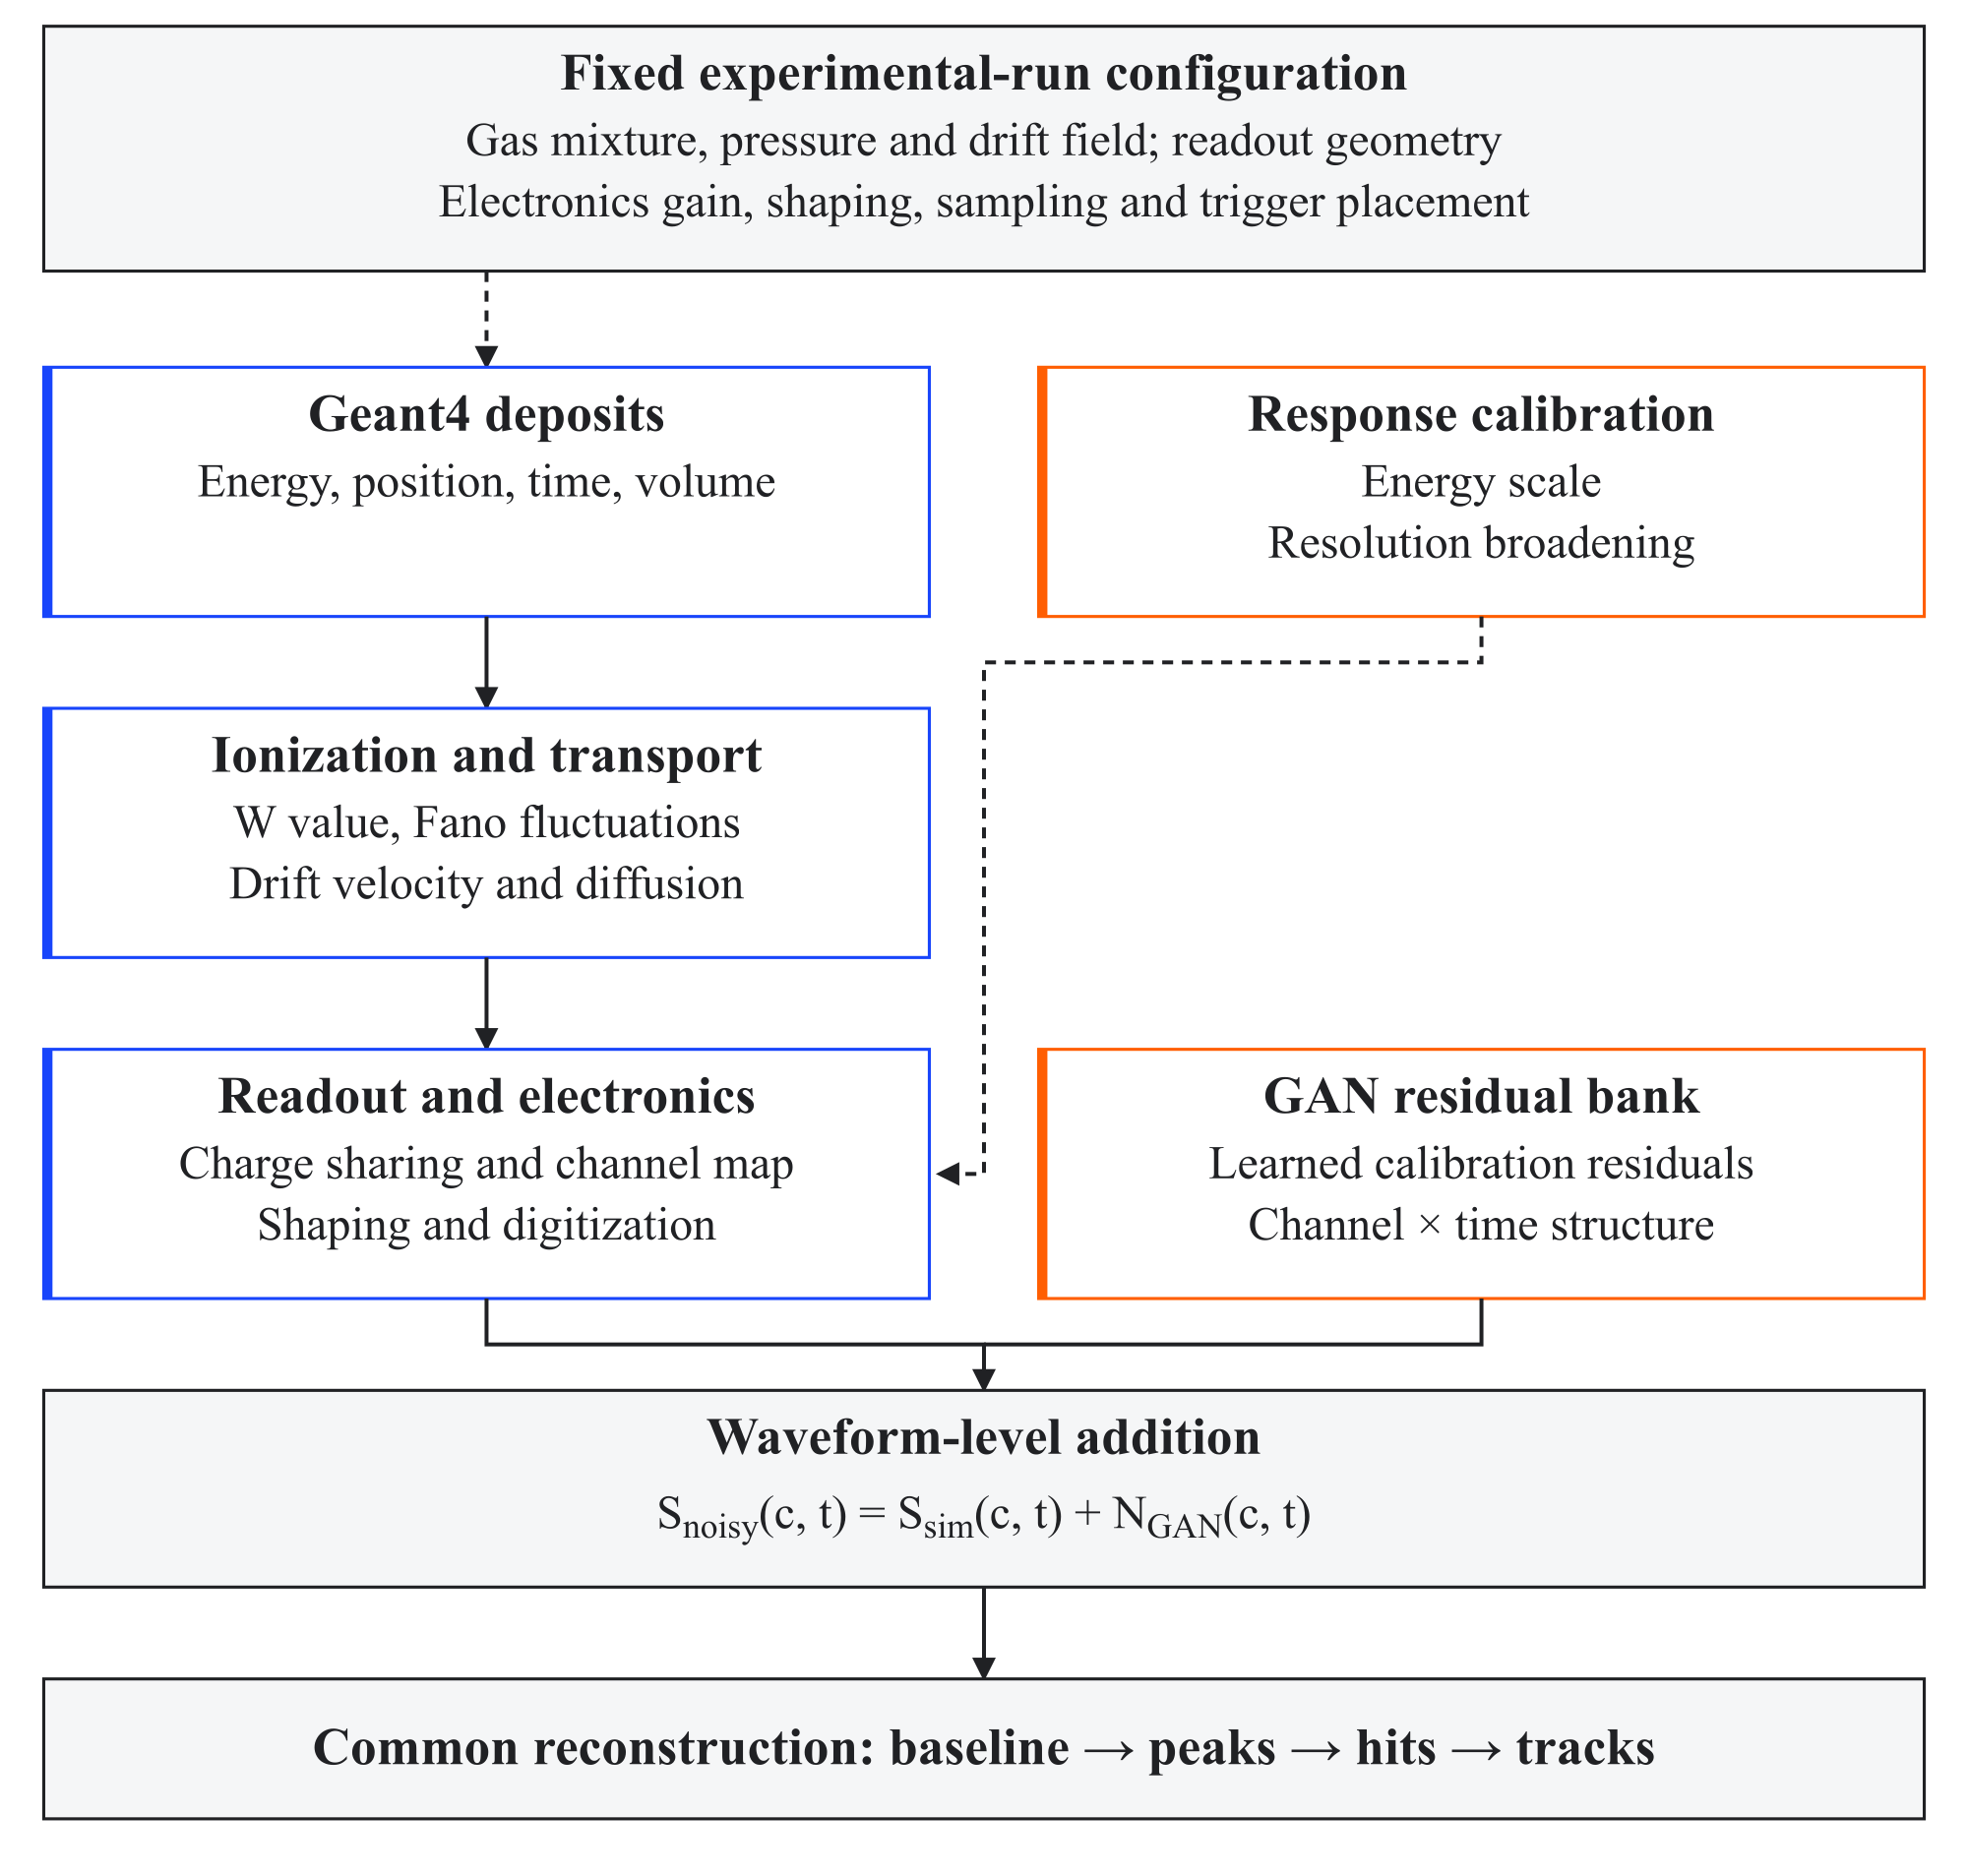
Geant4 deposits. Fixed experimental-run settings determine the deterministic response, while spectrum-level tuning is restricted to the energy calibration and additional smearing. A learned residual bank adds channel–time structure before the same baseline correction, peak finding, hit reconstruction, and energy-proxy algorithms used for measured data.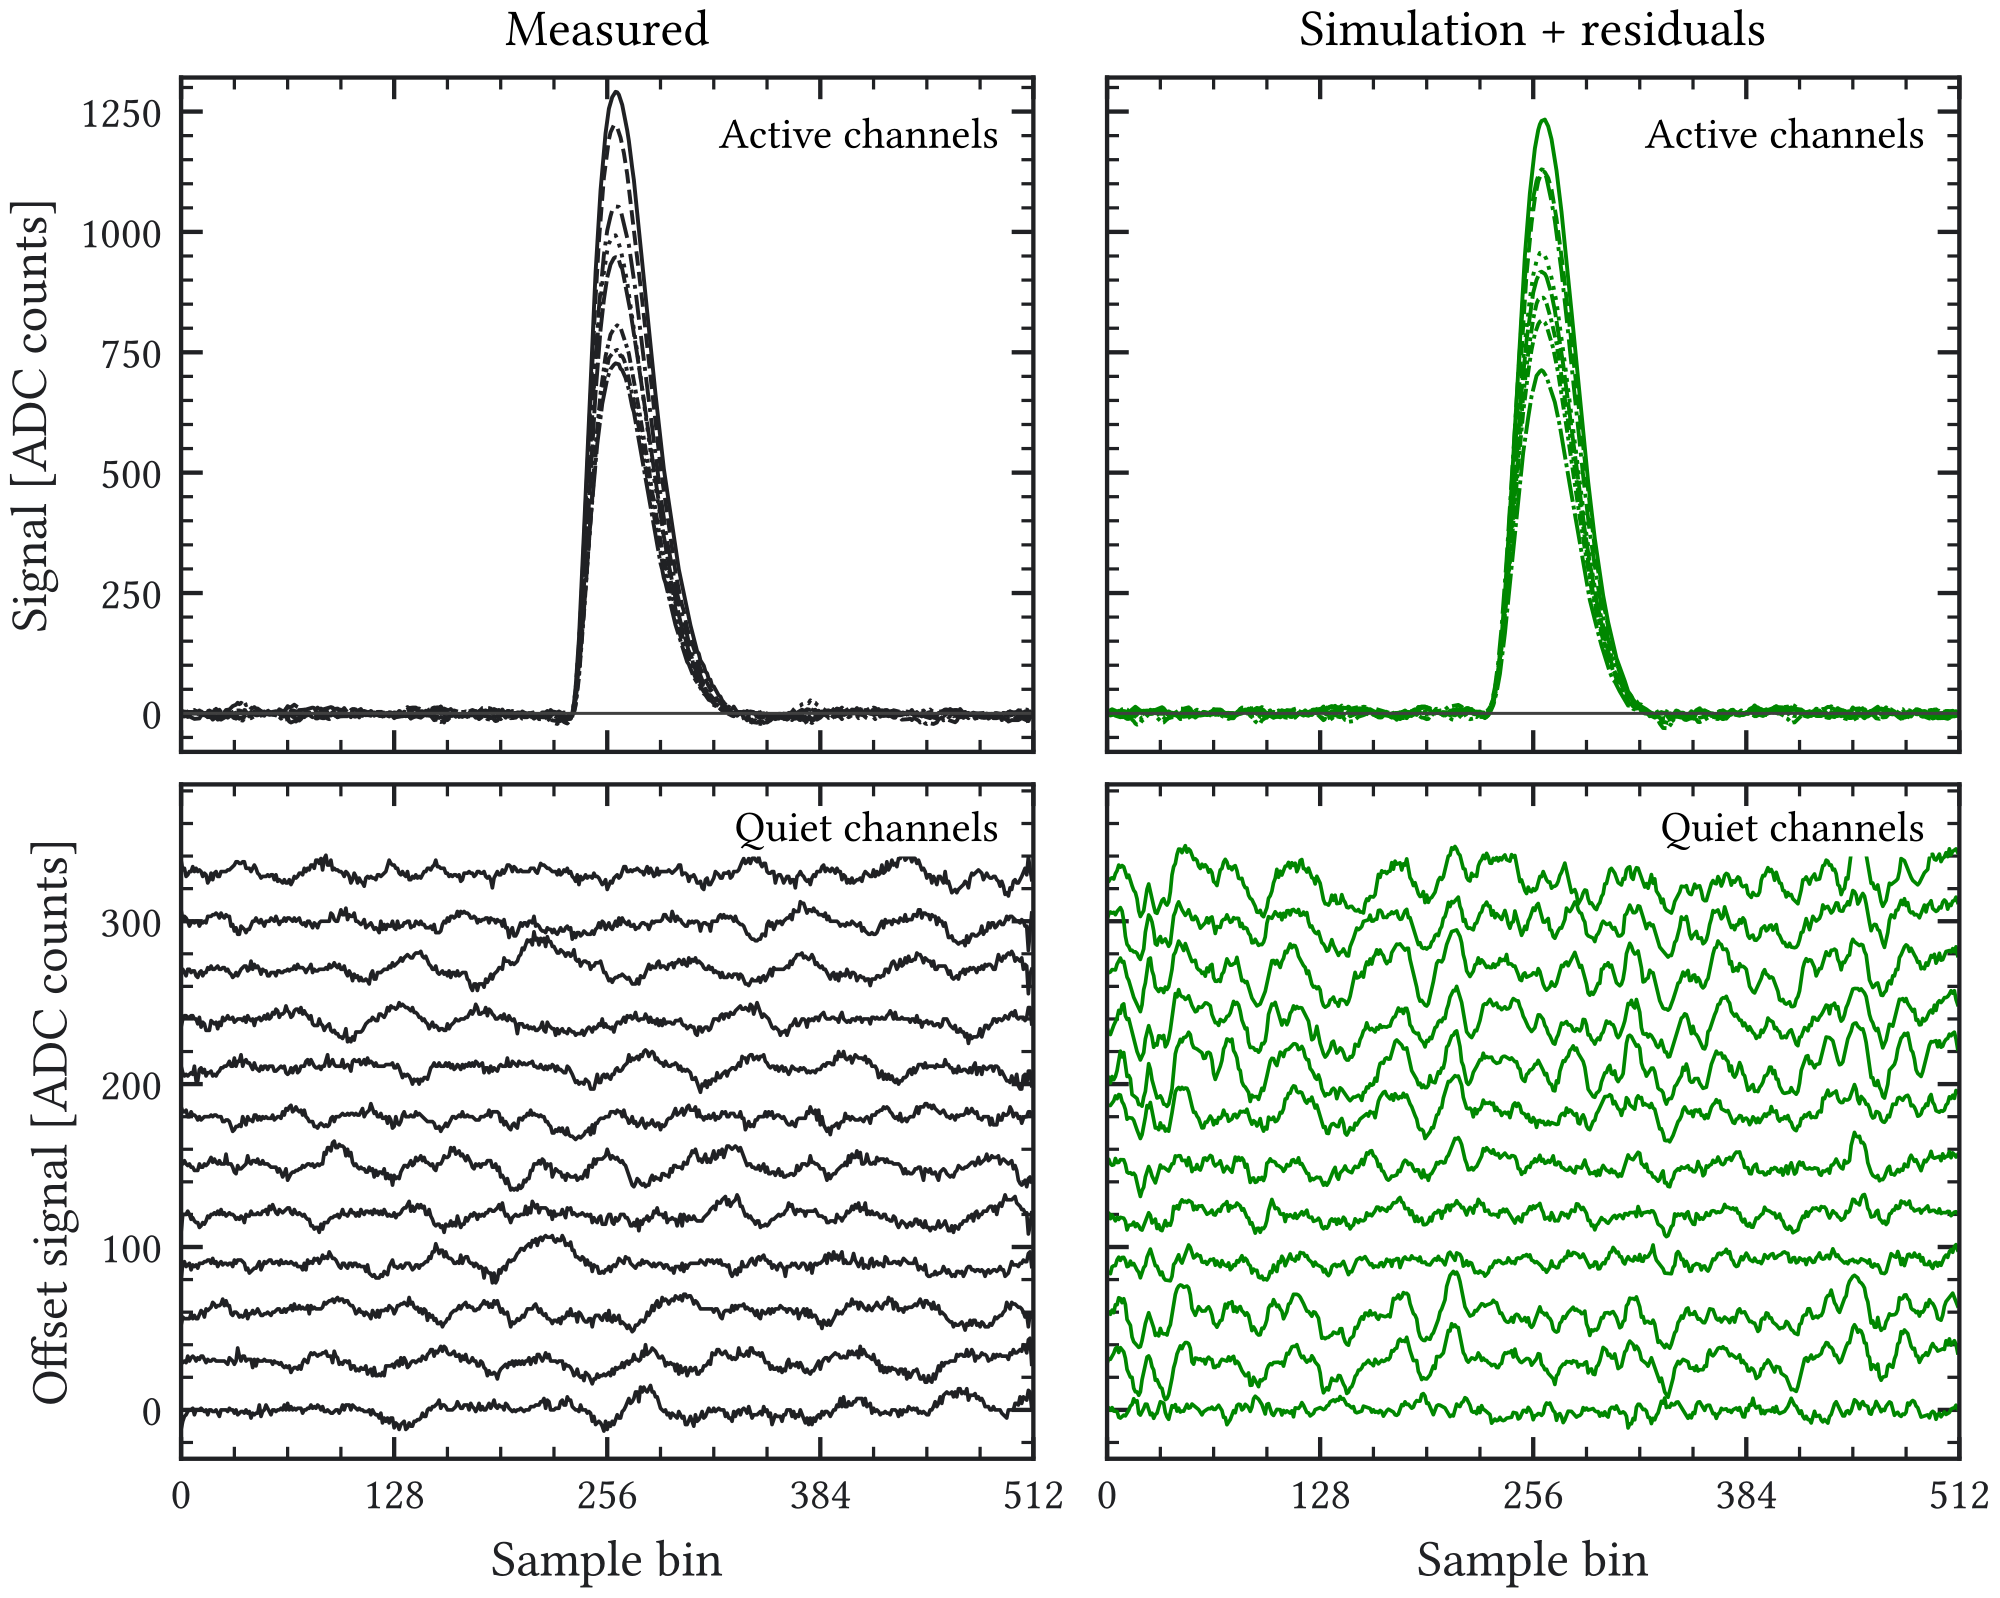
The implementation reads event-wise residual waveforms, maps them to TPC channel identifiers, and adds them to the simulated TRestRawSignalEvent before baseline correction and peak finding. This ordering allows noise to modify the same reconstructed quantities as in data. The demonstrated result is a reconstruction-compatible response model with illustrative waveform comparisons. Predictive validation requires fitting on one calibration subset and testing different runs after complete reconstruction, including pulse energy, width, active channels, false peaks, and selection retention. A measured baseline bank and a simple parametric noise model provide useful reference alternatives. The learned correction receives no efficiency credit until these comparisons close; this limitation does not affect the separate veto peak-list overlay study.
4.6 Geant4 simulation infrastructure
4.6.1 restG4 and Geant4Lib: the interface to Geant4
Geant4 [84–86] is a Monte Carlo toolkit for simulating the passage of particles through matter, widely used in high-energy physics, nuclear physics, and medical applications. Geant4 is a toolkit rather than a complete simulation application: users provide a C++ program that instantiates a geometry, physics list, and primary generator, and its run-time commands may then be exposed through macros or an interactive command interface. These applications share a large amount of boilerplate code, and Geant4 offers no built-in solution for serializing event data.
REST-for-Physics addresses this through restG4 (the executable) and Geant4Lib (the library): a modular, user-configurable Geant4 application that is driven by RML configuration files rather than recompilation. Over the period covered by this thesis, the wider restG4 and Geant4Lib development histories grew by more than 600 and 370 commits, respectively; the contributions described below are the subset authored, integrated, or validated in this work. The most significant improvements are summarized below.
4.6.1.1 Geant4 event model and REST-for-Physics representation
In the Geant4 framework, a run is a collection of events sharing a fixed detector geometry and physics configuration. A run is initialized once (an expensive operation that loads geometry and cross sections) and then executes many events. At the beginning of each event, the primary generator creates one or more particles with specified energies, directions, and positions. Radiation transport follows these particles in discrete steps whose lengths are limited by geometry boundaries, discrete and continuous processes, multiple-scattering controls, and user limits. Interactions can produce secondary particles, which are themselves tracked. The full chain of secondaries must be considered when calculating the energy deposited in a given detector region.
The principal Geant4 data structures (run, event, track, and step) are represented in Geant4Lib. Geant4 steps are stored as REST-for-Physics hits, which contain the position, momentum, time, energy, interaction process, and target information at a single point. Geant4 also provides user-action hooks at various levels (event, tracking, stepping); a stacking-action hook was added during this work to tag new tracks before processing, enabling long-lived secondaries to be isolated into separate sub-events with distinct sub-event identifiers while remaining traceable to the same Geant4 event.
4.6.1.2 Multi-threading and track pruning
Radiation transport is naturally parallelizable at the event level, since events are independent. During this work, support for Geant4 multi-threading was added to restG4, requiring a thread-safe event container and synchronization primitives with minimal performance impact. Support for interrupt-signal handling was also added, allowing a simulation to be stopped cleanly while preserving all output produced up to that point.
Track pruning was implemented to reduce output size and analysis time. The user specifies which detector volumes are of interest (e.g. the gas volume and the scintillator panels). Tracks and hits not associated with these volumes are removed, while the full track leading to a hit in a volume of interest is preserved, including intermediate steps through passive material, so that the surviving interaction paths can be visualized. Validation runs demonstrated output-size reductions of a factor of 1–10 for the tested configurations and checked the corresponding stored veto and TPC observables. This result does not establish invariance for every later response algorithm. Nonlinear quenching, for example, may depend on true step length and recoil identity in addition to deposited energy; delayed-event analysis requires times and parent–subevent associations. Those quantities must be retained and compared between pruned and unpruned records before a new response can be replayed safely.
4.6.2 Geometry-generation infrastructure for IAXO simulations
The IAXO detector geometries used in this thesis—including the IAXO-D0 and IAXO-D1 prototypes, passive-shielding scans, and successive veto-layer designs—were defined through a dedicated geometry-generation workflow rather than hand-edited Geant4 C++ code. The Geometry Description Markup Language (GDML) [91] is an XML-based format for describing detector geometries, supported natively by both Geant4 and ROOT.
The complexity of the IAXO geometry (over 400 individual components in some veto iterations) made manually writing GDML impractical. A Kotlin-based domain-specific language (commonly referred to as gdml.kt) was developed within the collaboration to build GDML files from a higher-level, parameterized description. The author collaborated in its continued development, validation, and application to the IAXO Micromegas simulation campaigns. The thesis contribution is not the invention of the Kotlin DSL itself, but the integration of that geometry-generation approach into the full simulation, analysis, veto-mapping, and visualization workflow.
The generated geometries are tracked in a dedicated Git repository, so each simulation can be associated with the commit hash of the geometry used to produce it. A hierarchical geometry description allows groups of related volumes to be enabled, disabled, or highlighted in the event viewer, connecting gdml.kt directly to the visualization package.
A technical challenge arose from Geant4′s handling of GDML assemblies: physical-volume names were converted into hashed identifiers during parsing, which prevented restG4 from mapping simulation properties (step-size limits, production cuts) to volumes by name. Significant effort was devoted to resolving these hashed names back to human-readable representations and to implementing support for logical-volume-name references, enabling properties to be assigned consistently to all instances of a repeated component. These developments made the complex IAXO geometries usable for production simulations in which detector materials, sensitive regions, and veto-channel definitions must remain traceable across many geometry versions.
The same semantic geometry information was used to validate the veto readout mapping. When the browser event viewer highlights a panel that received an energy deposit, the displayed panel, the Geant4 sensitive volume, the readout channel, and the analysis observable must all refer to the same detector element. Several iterations of the veto geometry and readout description were checked in this way, and the visualization package closed the loop: the Kotlin DSL produced the GDML, restG4 transported particles through it, the detector-response chain reconstructed signals using the readout metadata, and the browser viewer made it possible to inspect whether all these representations agreed event by event.
4.6.3 Python interface to REST-for-Physics
REST-for-Physics inherits ROOT’s PyROOT interface, which automatically generates Python bindings from the C++ class dictionaries. This allows REST-for-Physics objects to be used from Python with nearly identical syntax to the C++ API, as illustrated in Figure 4.6.
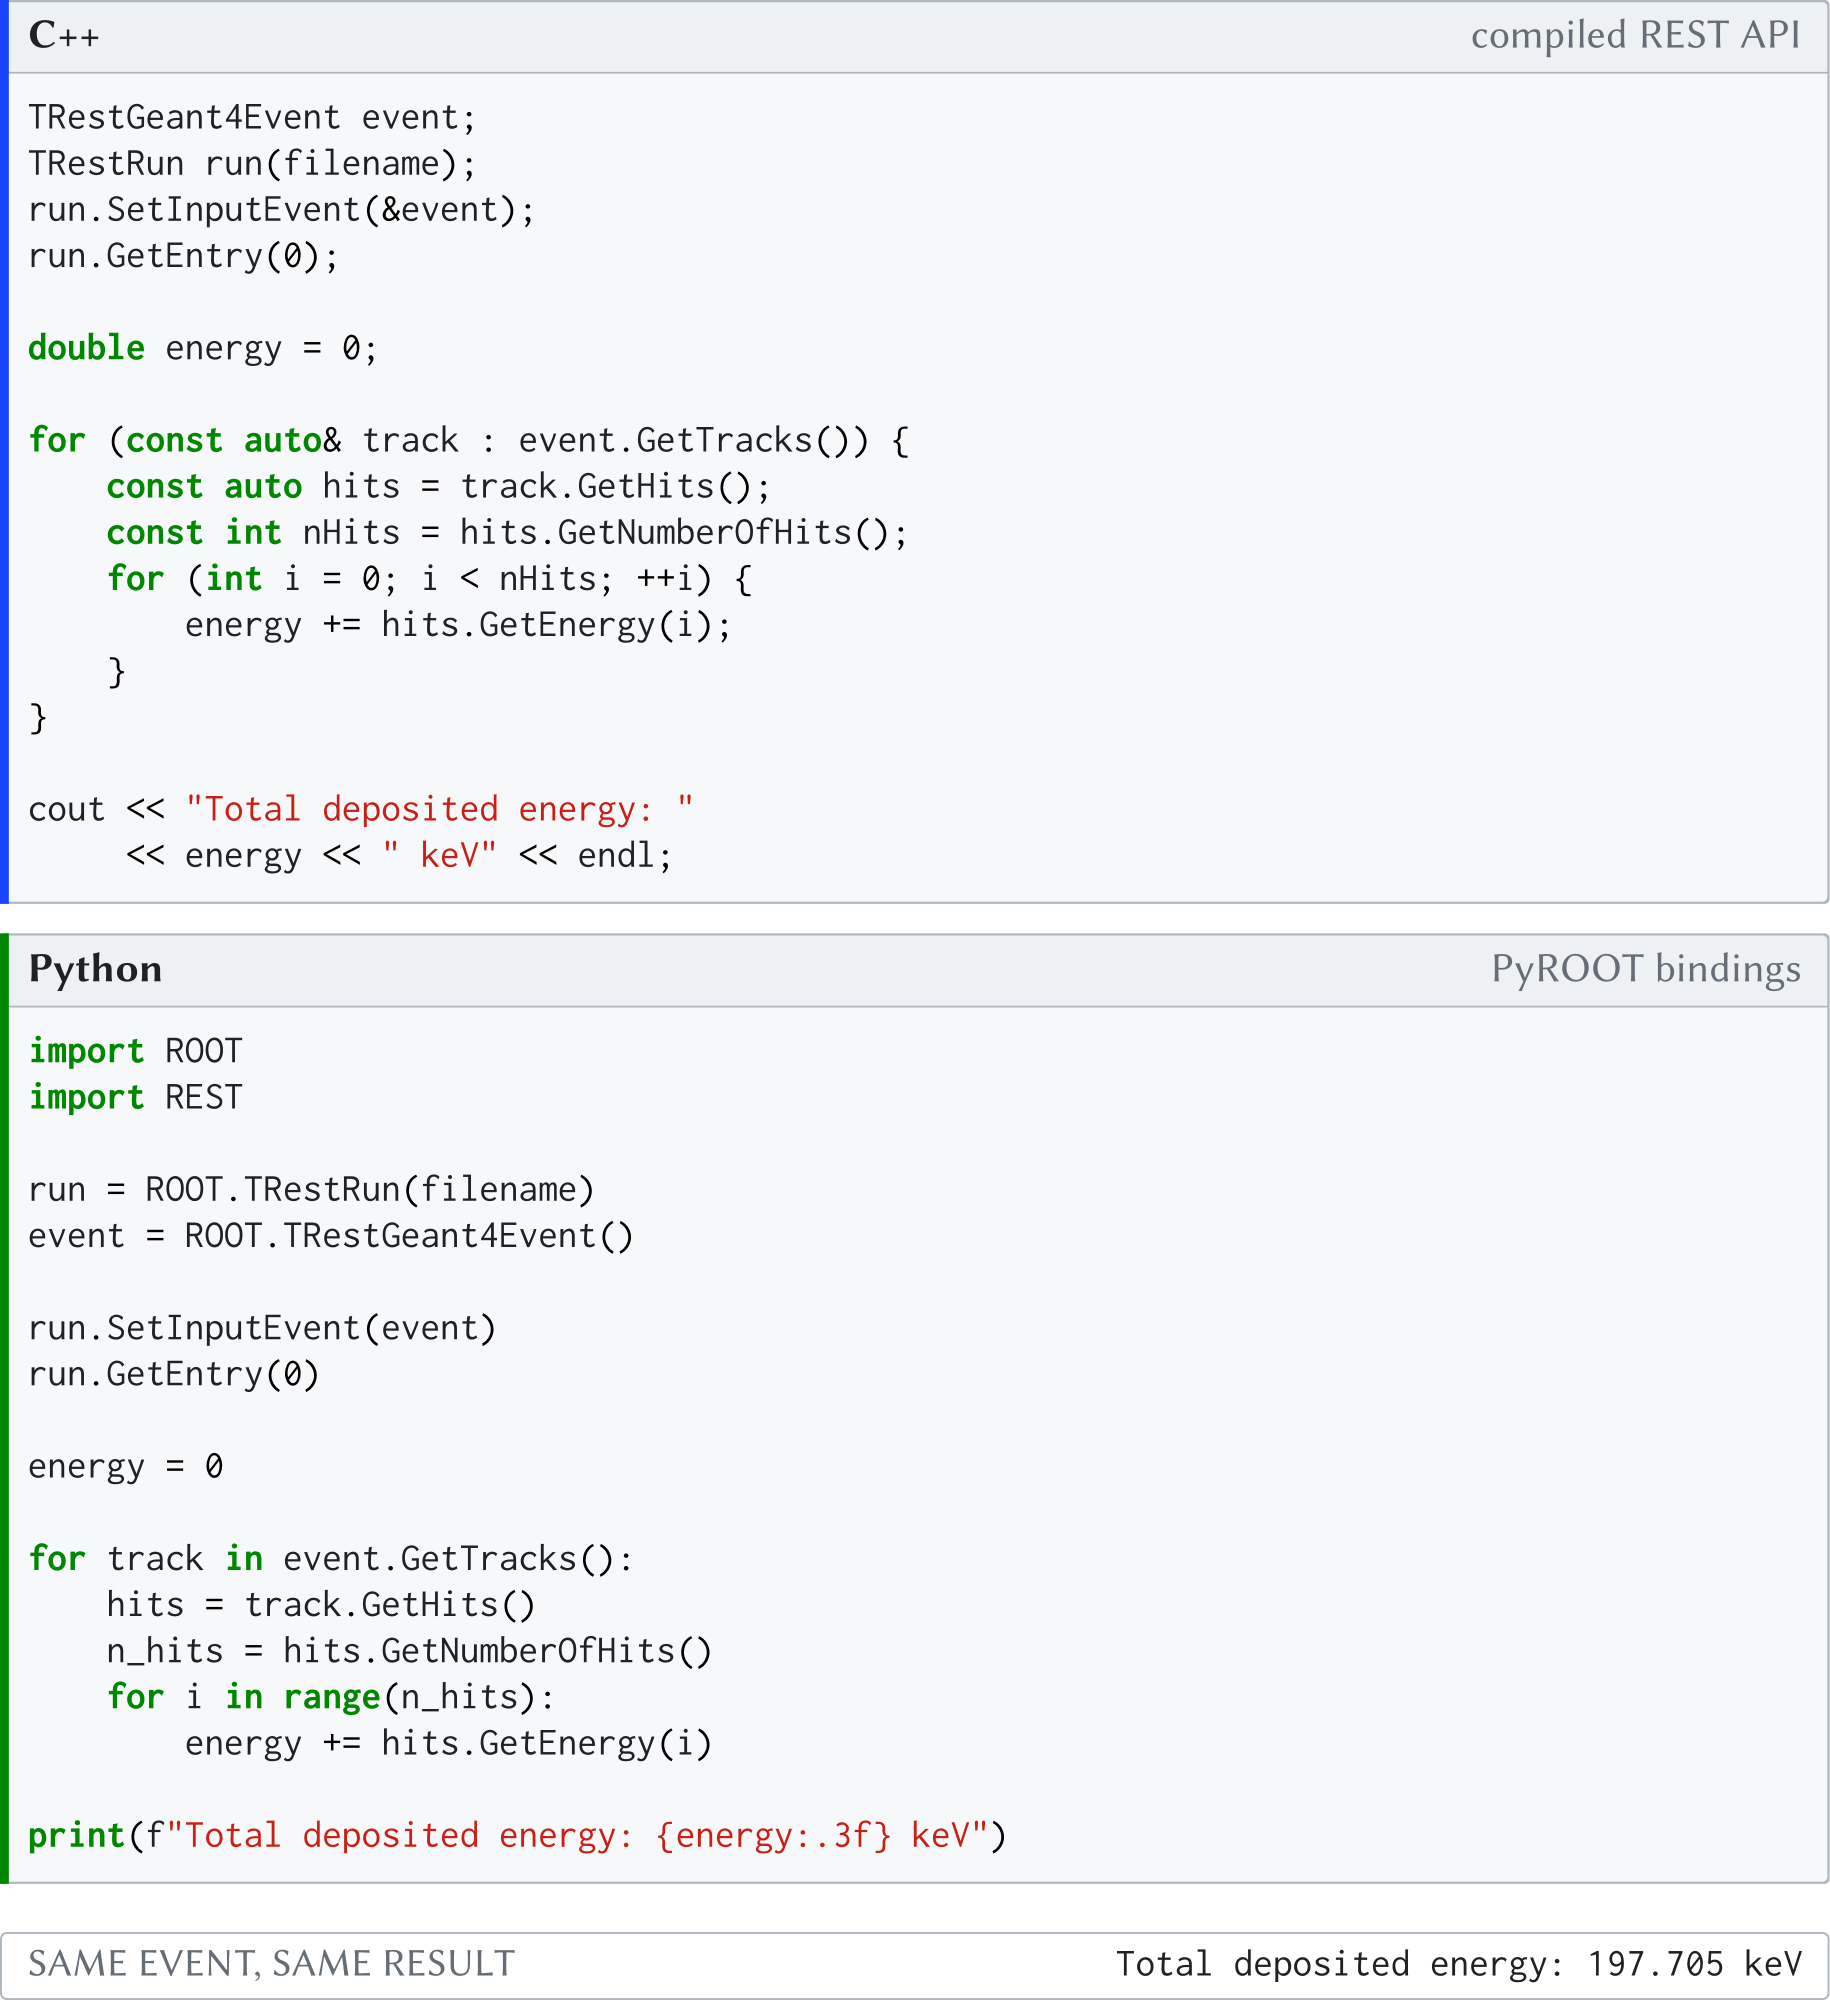
C++ and Python code computing the total energy deposited across all hits in a restG4 simulation. Both examples produce the same result; the Python version uses PyROOT bindings automatically generated from the C++ class dictionaries.The Python interface makes it possible to prototype analysis code quickly, integrate with the Python scientific ecosystem, and use Jupyter notebooks for interactive data exploration. The performance penalty of interpreted Python loops can be mitigated by using optimized array libraries such as Awkward Array [92] or by relying on compiled C++ backends. In the present thesis, the Python interface was used extensively for generating plots, scanning cut thresholds, and performing statistical analyses that would have been more cumbersome to develop in C++ alone.
4.6.4 Probability Distribution Projection cosmic-ray generator
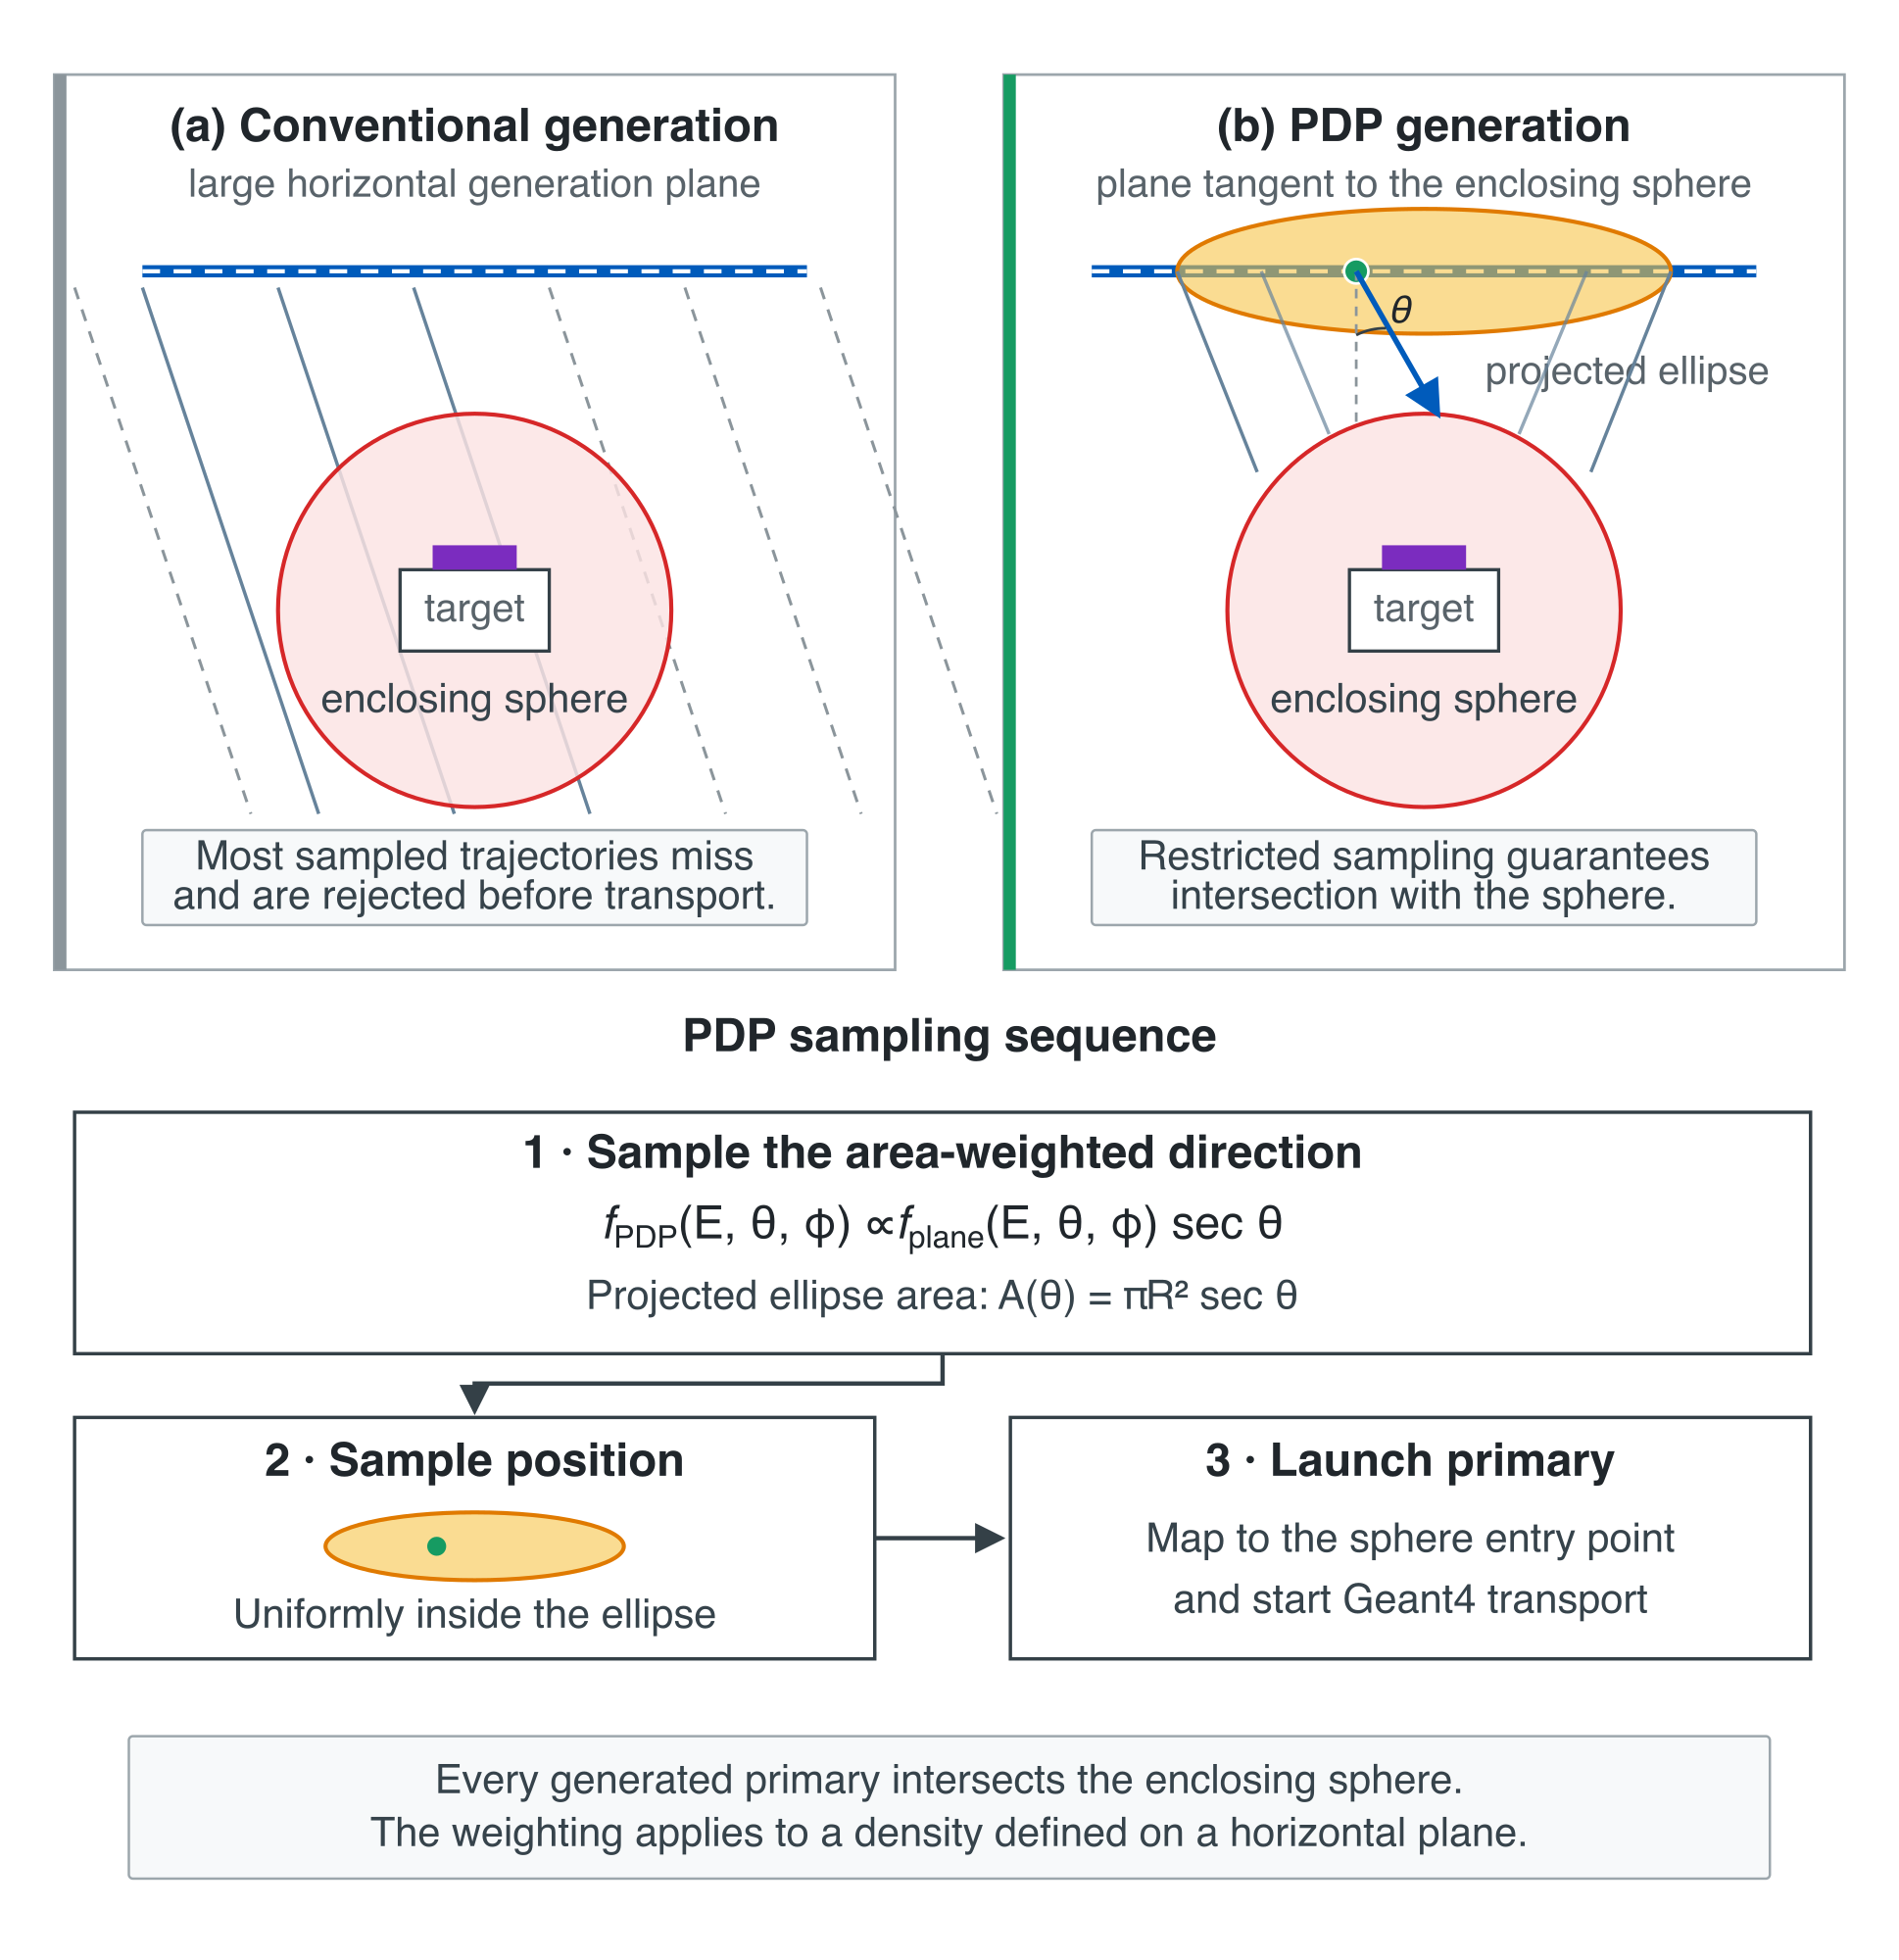
The cosmic-ray background simulations required for this thesis launch primary particles from the atmosphere toward the detector. The conventional approach—generating particles uniformly over a large plane above the detector and discarding those that miss—is physically intuitive but highly inefficient for compact geometries like the IAXO-D0 detector surrounded by shielding.
To address this, a new cosmic-ray generator was developed and published during this work [89]. The Probability Distribution Projection (PDP) method samples directly from the subset of trajectories that intersect a sphere enclosing the geometry of interest. For a fixed zenith angle, the allowed starting points are restricted to the ellipse obtained by projecting the enclosing sphere onto a plane tangent to it. Here the original distribution describes crossings of a horizontal generation plane, per unit zenith angle. The corresponding distribution for trajectories intersecting the sphere is
(4.2)
The measure matters: the same factor must not be applied again to a distribution already defined for an area normal to the incident direction. For directional intensity , per unit energy, solid angle, time, and area normal to the ray, the rates through a horizontal area and a sphere of radius are
(4.3)
over the specified incident hemisphere and energy range. Under azimuthal symmetry, . An unfolded energy-only fluence spectrum therefore needs both an explicit angular model and an adapter consistent with that model’s integration measure.
![Figure 4.8: Summary of the IAXO-D0 benchmark reported in [ 89 ]. The left panel shows saved events per effective computation second for three conventional generation-disk radii and for PDP; the right panel shows the corresponding physical background rate. Error bars reproduce the statistical uncertainties quoted in Table 2 of the source. As the conventional generation disk grows, its recovered rate approaches the PDP value, while its computation yield decreases.](assets/3c893b06ed9b1526356e3c43.png)
The method was validated against the standard Monte Carlo approach using two complementary observables: the zenith-angle distribution of intersecting trajectories and the distance distribution between the intersection point and the detector axis, which probes the spatial phase-space sampled by the generator. The comparison showed that the PDP method reproduces both observables within statistical uncertainties once the conventional Monte Carlo is run in its converged regime.
For the IAXO-D0 geometry, the PDP method improved the computation yield by a factor of approximately three compared with the fastest (and least accurate) conventional configuration. When compared at equal physical accuracy against the large generation disks needed for the conventional method to converge, the advantage reached up to a factor of about 37. This optimization was particularly valuable for the large cosmic-ray production campaigns discussed in the shielding and veto system chapter and the background model chapter, where the cumulative cost of low-efficiency simulations would otherwise have been prohibitive.
4.6.5 Cosmic-ray source generators
The simulation of cosmic-ray backgrounds involves two conceptually distinct tasks: generating the atmospheric secondary flux (performed with packages such as CRY [88] or CORSIKA [93]) and efficiently injecting those secondaries into the detailed IAXO Geant4 geometry. The PDP method addresses the second task; it does not replace shower generators but provides a more efficient way of sampling the already-modeled flux around the detector.
A dedicated auxiliary program was developed to precompute the cosmic-ray secondary distributions used as input for the Geant4 simulations [94]. The program runs CRY for a chosen site configuration, including latitude, date, altitude, and lateral generation box, and records the secondary particles crossing the generation surface. For each relevant particle species, the output is reduced to two-dimensional histograms in kinetic energy and zenith angle, , stored in ROOT files for muons, electrons, positrons, photons, protons, and neutrons. The histograms retain each species’ joint energy–zenith distribution, while the later restG4 generator samples its direction and entry point around the detector. They do not retain the relative positions, arrival times, or particle-species correlations within a CRY shower. The resulting transport describes independently sampled particles; a companion from the same atmospheric shower can provide an additional veto tag that this representation omits. Conditional veto efficiencies and random-coincidence estimates therefore require a separate correlated-shower check before this approximation can be assigned an absolute uncertainty.
This design deliberately decouples the atmospheric calculation from the detector transport. Instead of calling CRY inside every detector simulation, the atmospheric source term is computed once and reused across passive-shielding scans, veto-layer geometries, and production campaigns. It also makes the source term inspectable: the same ROOT histograms can be plotted, compared with EXPACS or HENSA measurements, or replaced by a different measured spectrum without changing the detector-response chain. For HENSA, the intended angular model is proportional to , while the measured input supplies the energy spectrum. The historical histogram reader additionally applies the plane-to-sphere cosine transformation. The actual generated distribution and energy acceptance must consequently be checked through that complete interface, as discussed in Section 6.6.1; a test of an isolated analytic angular generator does not validate the histogram adapter.
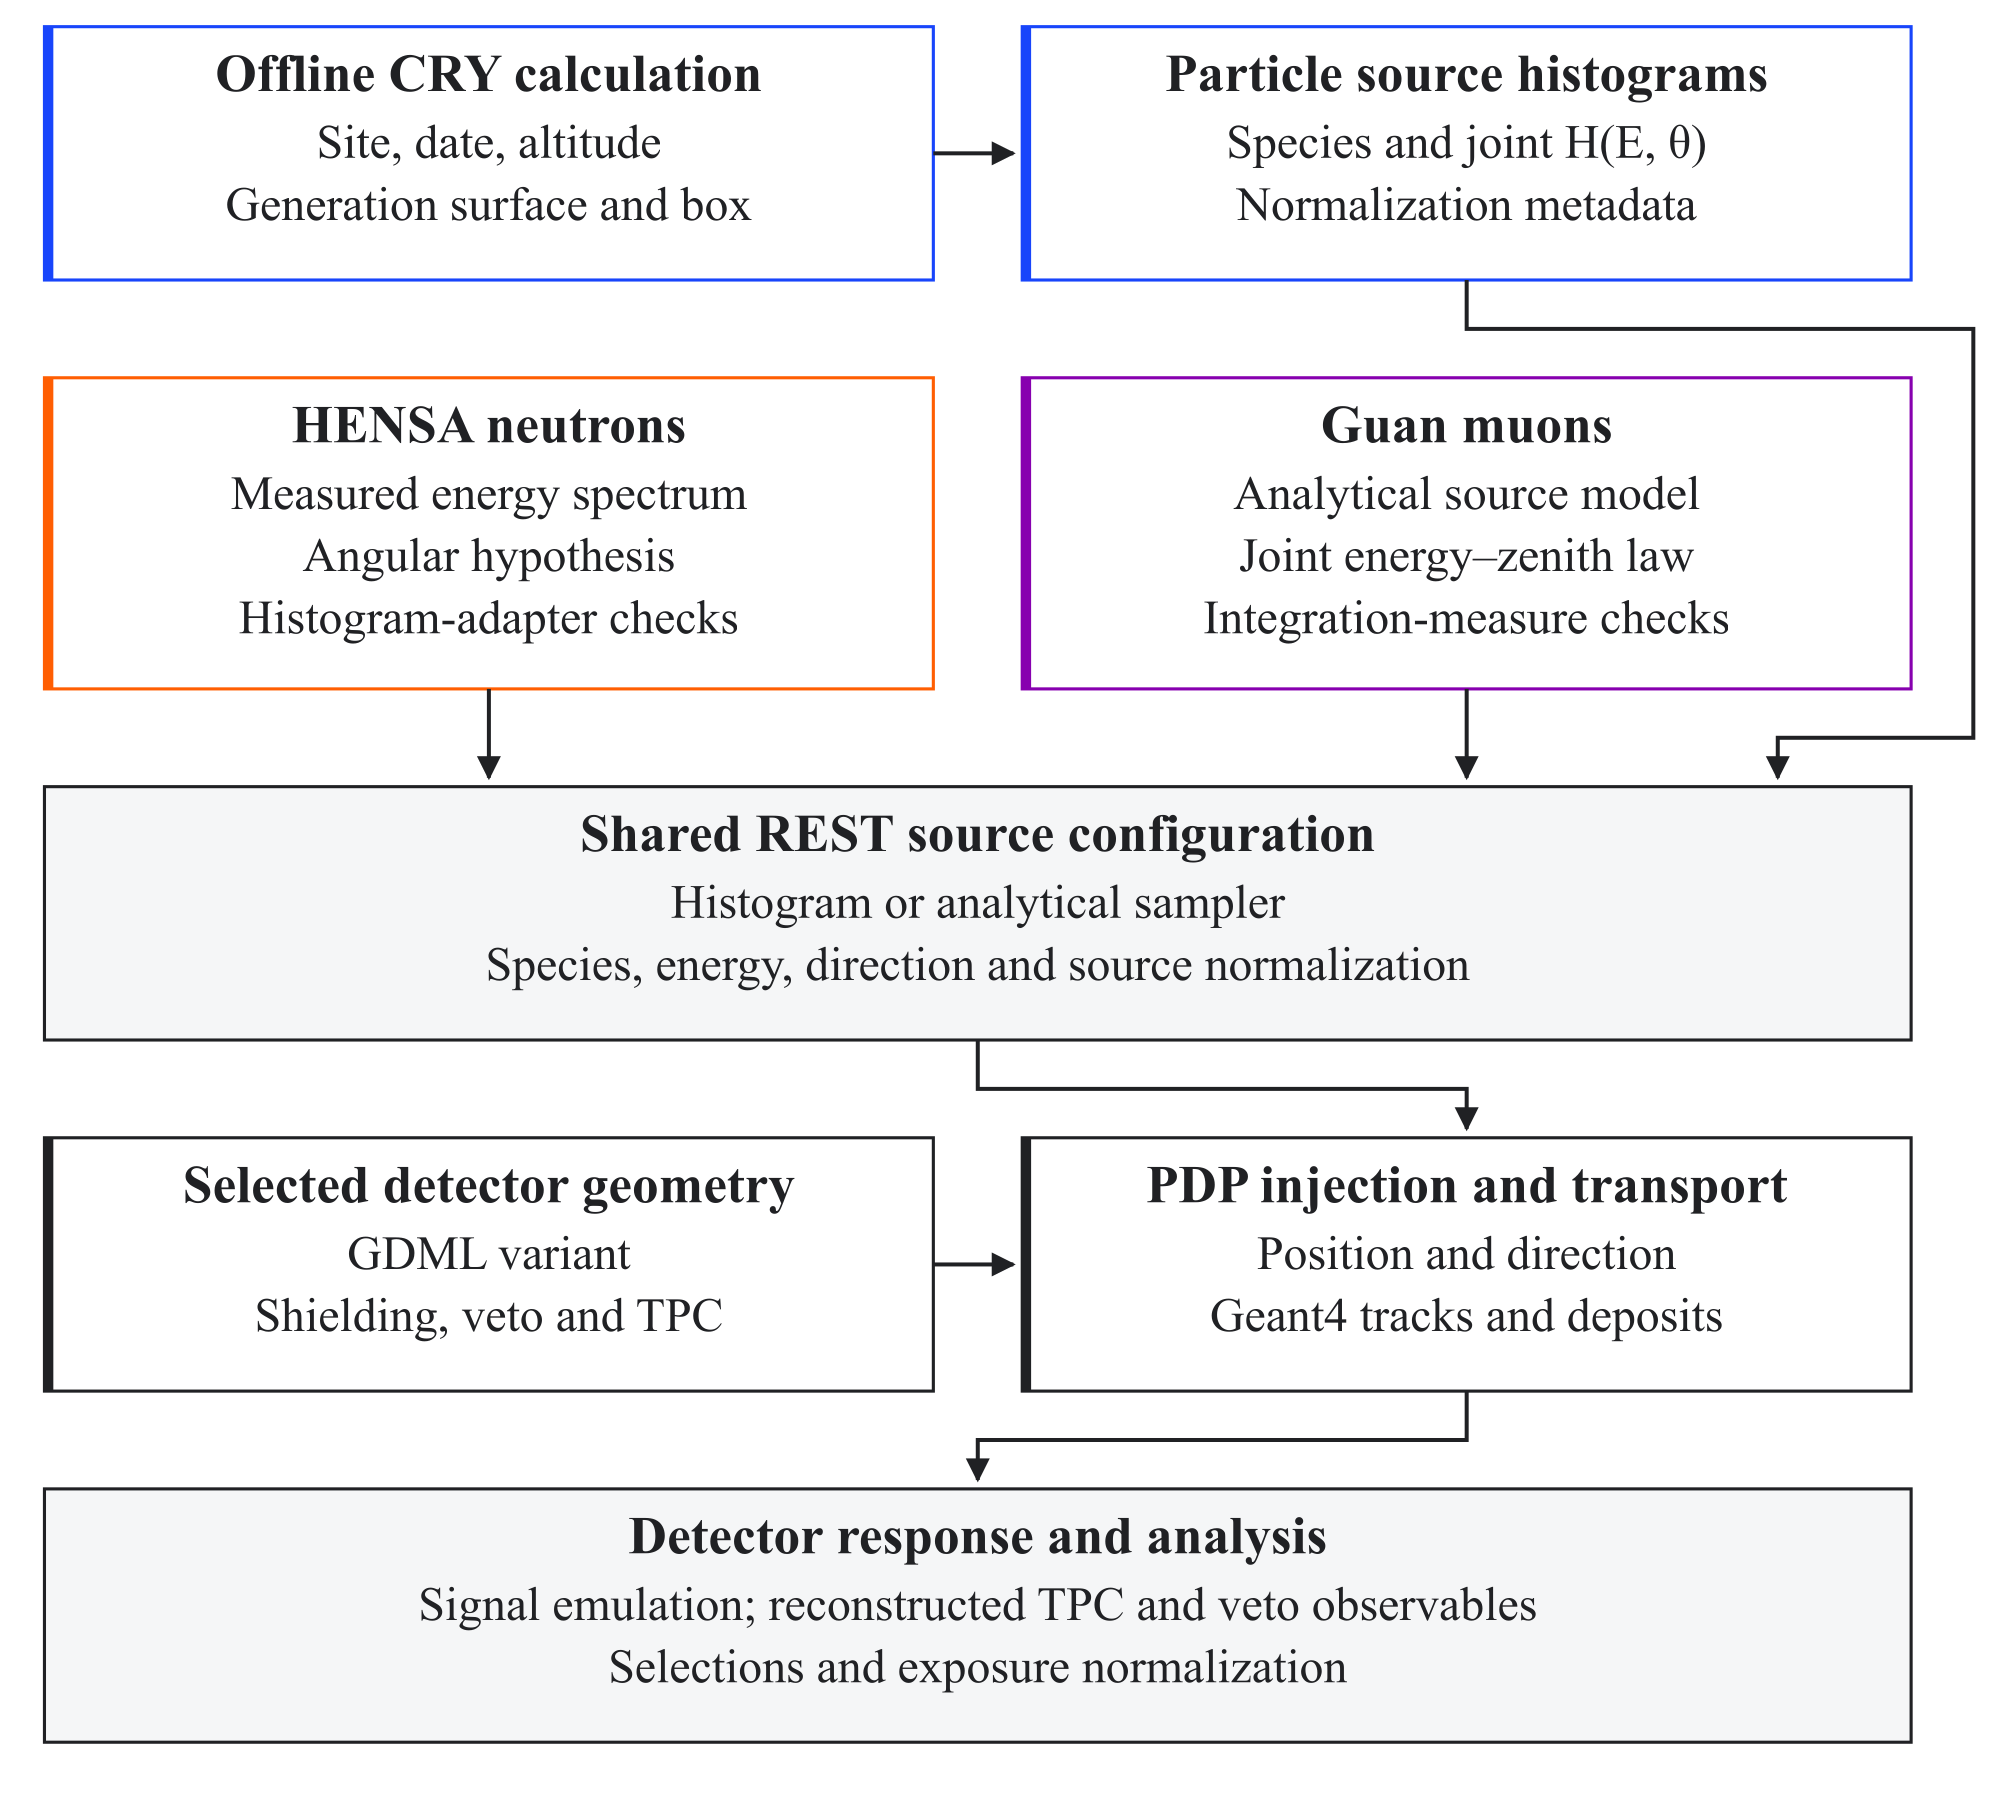
REST-for-Physics. A CRY calculation produces particle-specific histograms; the measured HENSA energy spectrum and analytic Guan muon distribution provide alternative source inputs. Their units, angular measures, energy support, and exposure normalization must be preserved by the injection interface. The source is combined with the selected geometry before transport and detector-response analysis. Solid arrows denote processing flow and dashed arrows denote configuration dependencies.The production interface ultimately accepted several source implementations. The background studies use the analytic Guan distribution for muons, CRY for photons, protons, electrons, and positrons, and the measured HENSA spectrum for the nominal outdoor-neutron energy distribution. CRY remains a generator-level cross-check for muons and neutrons and was used to test the neutron angular prescription.
4.6.6 Radiation transport in gases: Garfield++
Garfield++ is a widely used software package for simulating the behavior of gaseous detectors. Within REST-for-Physics, it is an optional dependency used to precompute gas-transport parameters such as electron drift velocity, diffusion coefficients, and Townsend and attachment coefficients as a function of the applied electric field. These parameters, illustrated by the gas-transport comparison in Figure 4.5, are then used by REST-for-Physics to model the drift and diffusion of ionization electrons in the TPC gas volume without performing a full Garfield++ particle-by-particle transport, which would be computationally prohibitive.
A small companion tool, gas-cli, was developed to make this gas-table workflow reproducible and scalable [95]. The program provides a command-line interface for generating, reading, and merging Garfield++ gas files, including mixtures with several components, configurable pressure and temperature, and electric-field grids defined by explicit points or linear and logarithmic ranges. This was useful because gas-file generation with Garfield++/Magboltz is compute intensive. Once the calculation is expressed as a deterministic command or Docker invocation, large scans over gas mixtures and electric fields can be dispatched to high-throughput computing resources and later merged or queried in a uniform way. The same tool can extract gas properties such as drift velocity, longitudinal and transverse diffusion, Townsend coefficient, and attachment coefficient into JSON summaries, which makes it straightforward to compare physical properties across candidate mixtures while preserving the .gas files consumed by the detector-response chain.
The full Garfield++ microscopic transport was not integrated into the restG4 simulation chain; it was used only for generating the precomputed gas-parameter tables that the REST-for-Physics detector-response processes consume. Explicit integration of Garfield++ with Geant4, as described in [96], remains a potential future improvement, but was not required for the background-model studies presented in this thesis.
4.7 Visualization, online diagnostics, and detector operations
4.7.1 Browser-based Geant4 event viewer
REST-for-Physics provides a ROOT-based 3D event viewer using TEve, but this interface has significant limitations: CPU-based rendering is slow for complex geometries, the backend technology has not seen major updates in recent years, and the largest event–geometry combinations tested in this work were not displayed reliably.
During this thesis, a dedicated browser-based event viewer was developed for REST-for-Physics Geant4 output files. The package converts selected windows of REST-for-Physics ROOT files into a compact JSON scene representation and renders the detector geometry and event history in a web browser using three.js. The central design choice was to keep the heavy ROOT/REST-for-Physics dependency on the server or conversion side, while keeping the browser client simple and portable.
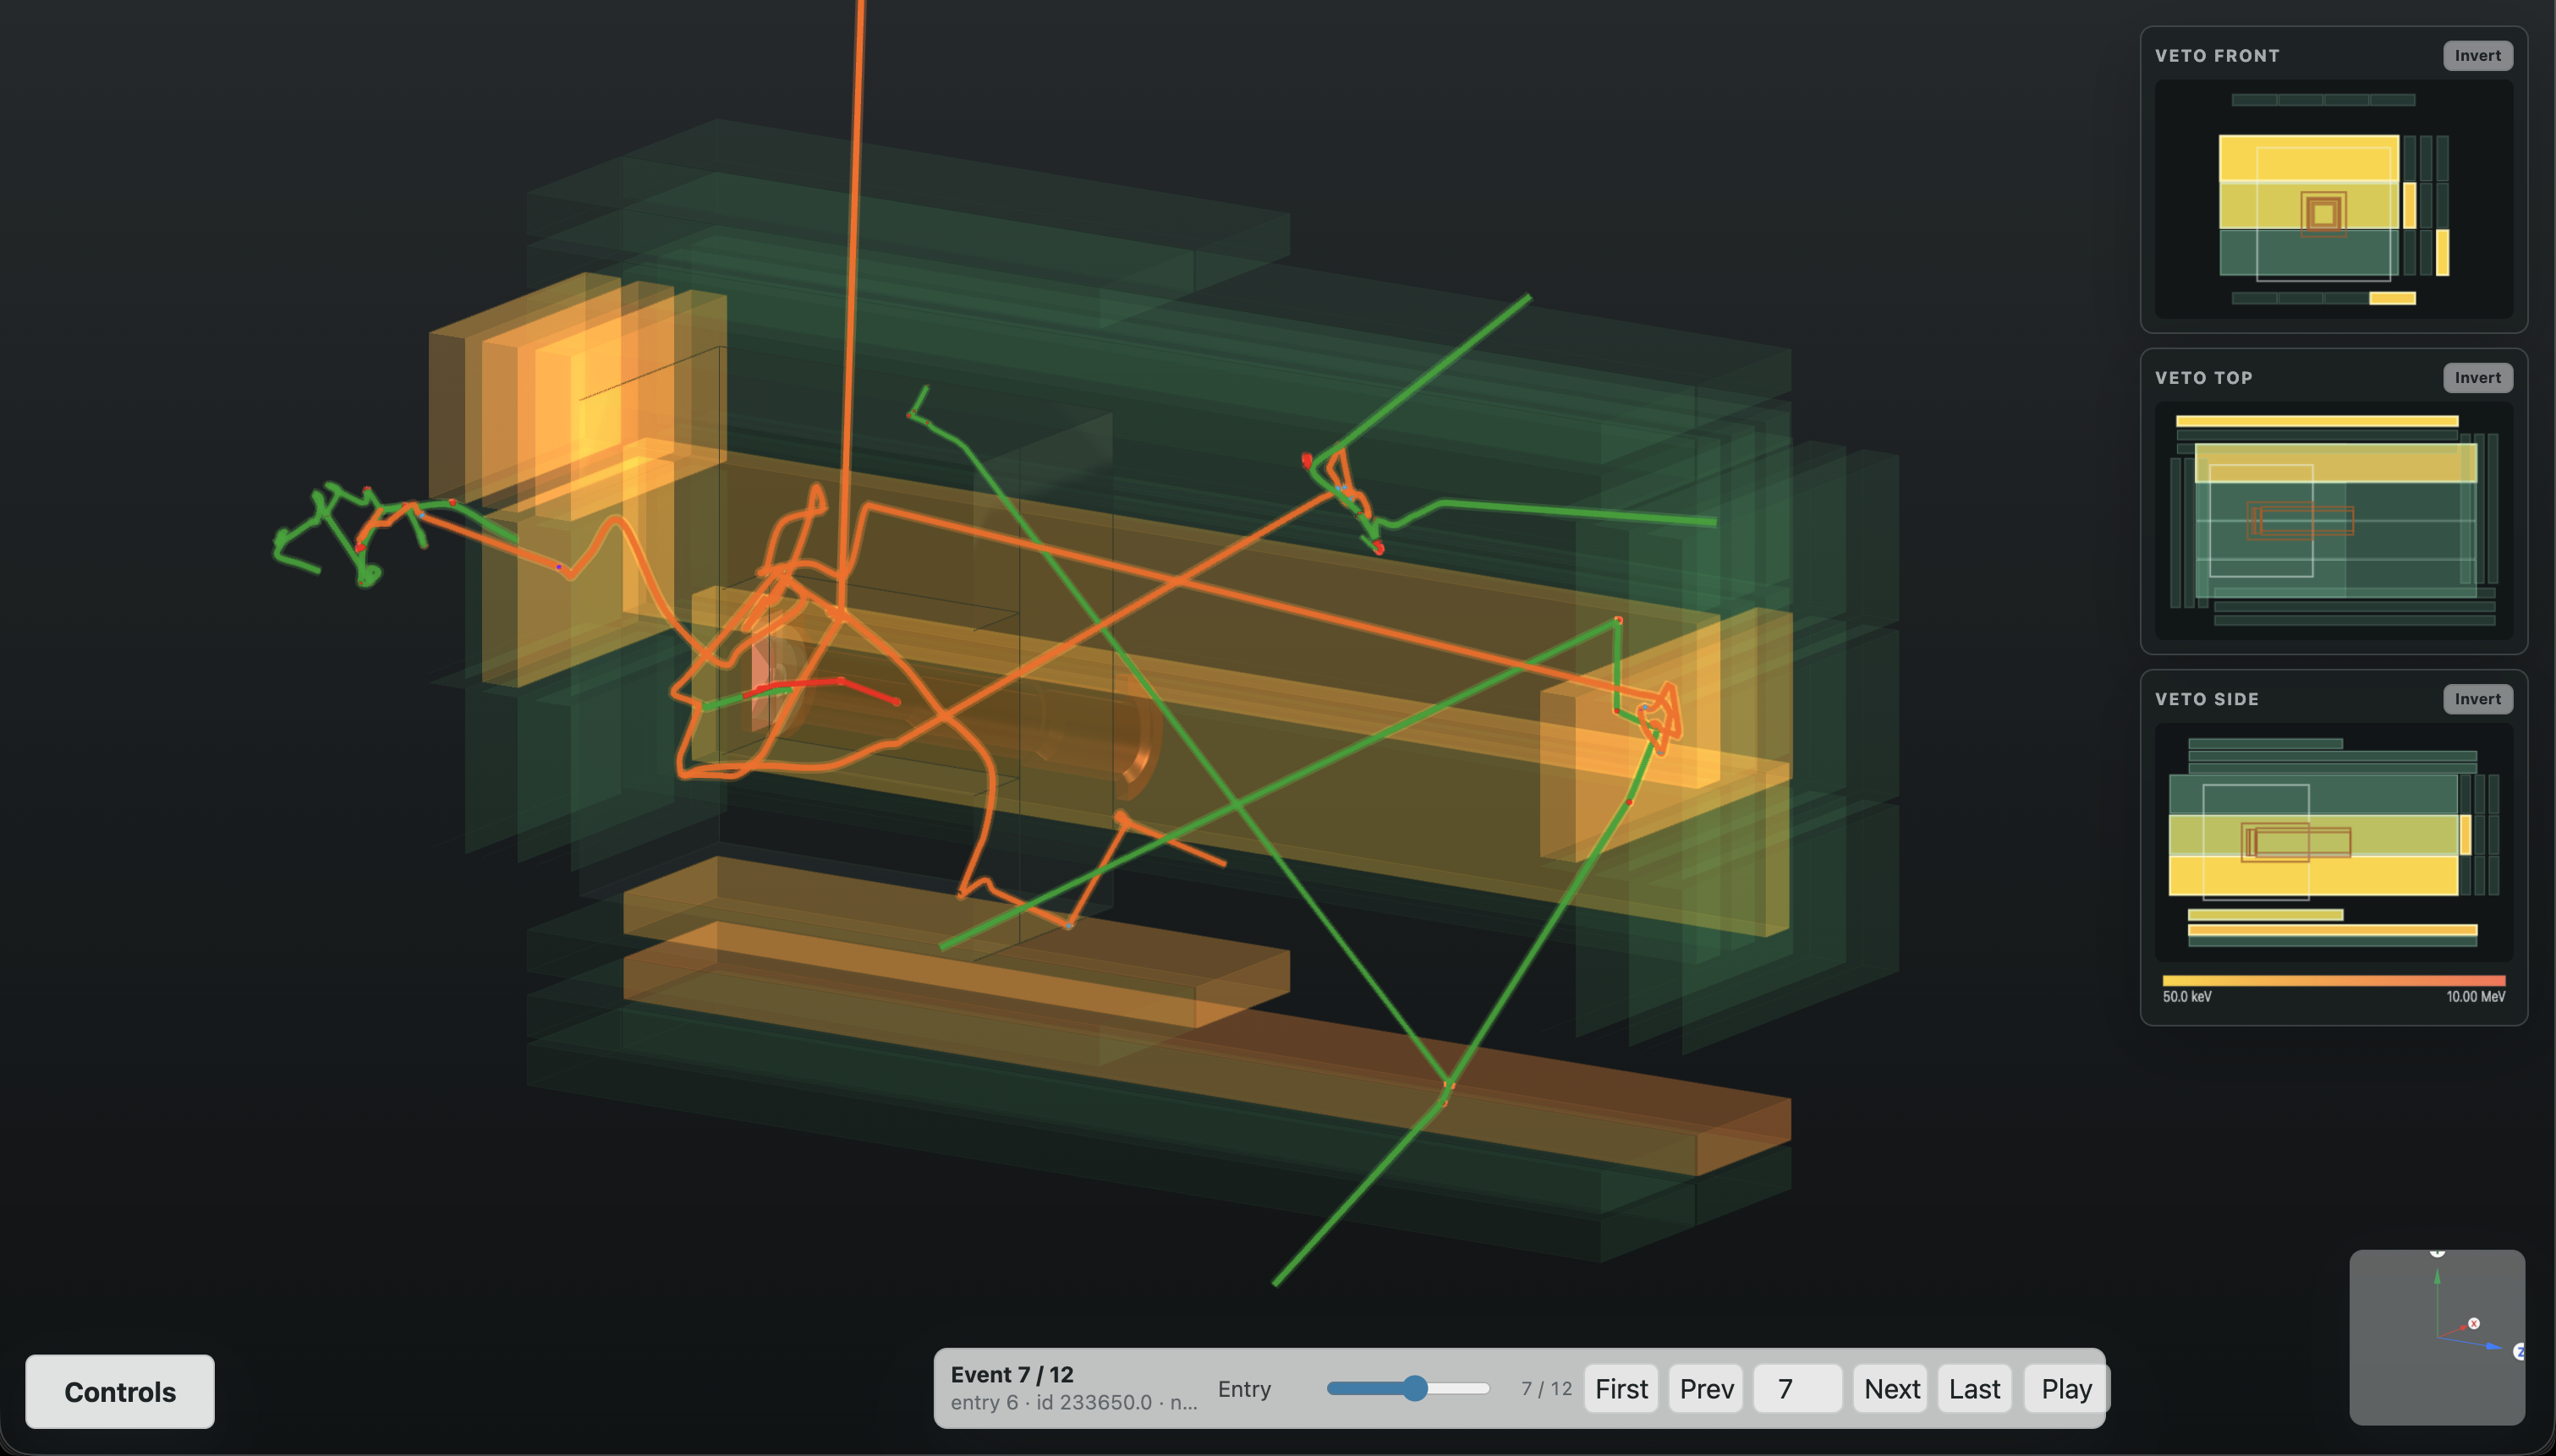
REST-for-Physics Geant4 event viewer developed during this thesis. The main panel shows the IAXO detector geometry with simulated particle tracks from a cosmic-neutron event and highlighted scintillator panels receiving energy deposits. The four side panels provide compact orthographic veto projections of the front, left, top, and right scintillator groups, with the active detector elements visible at the center.The viewer was developed with three primary use cases in mind:
Geometry and readout validation. The viewer renders the detector with a role-aware material model: gas volume, copper vessel, shielding, scintillator panels, cadmium layers, light guides, photomultipliers, and auxiliary elements are assigned distinct colors, transparency values, and visibility controls. This allowed systematic checks that the Kotlin-generated GDML, the
restG4geometry import, the sensitive-volume definitions, the readout metadata, and the reconstructed veto observables were mutually consistent. If the viewer showed a veto panel highlighted by the analysis but no plausible track or capture near that panel, the problem could be traced to the mapping, timing, or reconstruction rather than to the transport simulation.Veto and delayed-capture topology debugging. The event history is displayed as a time-dependent object: particle tracks are colored by particle type, and the user can play the event in time with a configurable hit lifetime. This was particularly useful for cosmic-neutron studies, where the relevant signature can involve a prompt cascade, a delayed neutron capture, and energy deposits in different veto layers separated by microseconds. Several projection modes were added because the IAXO geometry is elongated and surrounded by a layered veto system; the four-panel orthographic view with compact veto maps immediately shows whether an event activates opposite sides, adjacent layers, a local cluster, or a delayed capture-like pattern.
Shareable event inspection and figure generation. The deployed viewer supports browsing a curated set of
ROOTfiles, converting only the requested event window, and caching the resulting scene. The cache makes it possible to share stable URLs pointing to a particular file, event entry, and view direction, which is useful when discussing a suspicious topology with collaborators or preparing a thesis figure. Publication-oriented export tools include a single-frame export with veto projections attached and a sequence export that samples the event timeline and writes a reproducible set of frames. The neutron event sequence shown in the background model chapter was produced with this workflow.
The development of this package was closely connected to the geometry and readout work described in Section 4.4 and Section 4.6.2. In this sense, the visualization package was not only a presentation tool but also a development instrument used to find geometry mistakes, volume-orientation problems, wrong particle color mappings, missing process labels, and inconsistencies in veto-channel interpretation.
The Phoenix event display [97], an open-source project supported by the High Energy Software Foundation (HSF), provided a useful reference during development. The IAXO viewer was not developed as a fork of Phoenix, but the Phoenix architecture demonstrated how modern browser-based event displays can replace traditional desktop-only visualization tools in high-energy physics.
4.7.2 feminos-daq: acquisition software and online viewer
The Micromegas readout hardware described in Section 3.5 requires a software layer able to configure the Feminos boards, receive UDP data frames, decode the AGET waveforms, store run metadata, and expose enough online information to diagnose the detector during data taking. The original program supplied with the Feminos electronics, mclient, was written in C and stored the received frames in a dedicated binary format, conventionally using the .aqs extension. That approach was sufficient for CAST and for the first IAXO Micromegas tests, but it made online inspection, long-term format maintenance, and integration with the later ROOT/REST-for-Physics analysis chain unnecessarily cumbersome.
During this thesis, the DAQ program was refactored into the feminos-daq repository [98]. The low-level communication with the Feminos boards was preserved where appropriate, while the surrounding software was reorganized around a modern CMake build, C++17, a clearer command-line interface, and direct output to regular ROOT files. The legacy binary output mode remains available for compatibility, but the ROOT format became the preferred output because it can be read with standard ROOT tools or with Uproot [90] without loading experiment-specific dictionaries. This makes raw acquisition data immediately usable from both the detector-control environment and the offline analysis notebooks.
The refactor also added a Prometheus exporter [99], so that acquisition counters and health information can be scraped by the slow-control and monitoring infrastructure. This is important operationally because DAQ failure modes are often visible before they appear in an offline file: malformed frames, missing boards, increasing queue occupancy, or abnormal trigger rates can all indicate detector or network problems during a run. In this sense, feminos-daq is not only a file writer, but part of the experiment-control layer that connects electronics status, detector conditions, and acquired data.
Data storage and file structure
The acquisition process is naturally I/O bound: the program must receive UDP frames from one or more Feminos boards, decode them, optionally compute lightweight online quantities, and write the result to disk without blocking packet reception. To reduce the risk of data loss, feminos-daq separates data reception from event processing and file writing. Incoming frames are passed through an internal queue to a processing thread, which writes the decoded events into the output ROOT file while the receiving thread remains available for new network data. The queue absorbs short processing delays, but it also provides a useful diagnostic because sustained queue growth signals that the writer cannot keep up with the incoming rate.
The output file is flushed periodically, so that an unexpected stop of the DAQ process does not make the entire run unrecoverable. Each file contains a tree of raw events with the event-level metadata and the waveform samples associated with each active signal. Since the file avoids custom ROOT dictionaries, it can be inspected with a plain ROOT installation, processed directly with Uproot, or converted into the REST-for-Physics raw-event format used by the later reconstruction chain.
ROOT compression
DAQ data have different storage regimes depending on the run type. Calibration runs can produce incoming rates of several MB/s because many channels are read out for source-driven events, whereas background runs are usually much lighter. The output format therefore has to balance acquisition safety, write speed, read speed, and long-term disk usage. The feminos-daq implementation exposes compression choices, with high-compression LZMA used as the default and a faster mode available for high-rate calibration conditions.
Table 4.4 summarizes a benchmark performed with a calibration run of 52 194 events, each containing approximately 272 signals with 512 samples per signal. The study compared sample storage types and compression settings using ROOT v6.32.02. The default LZMA setting reduced the file size relative to the default ZLIB output, while the maximum-compression setting saved additional space at a write-time cost too high for routine acquisition. The tested tightly packed unsigned char representation did not provide a practical advantage over unsigned short: although the uncompressed payload would be smaller, the compressed file size remained similar and the extra packing and unpacking logic would complicate the writer.
| Storage type | Compression | Write time (s) | Read time (s) | File size (GB) | Branch compression |
|---|---|---|---|---|---|
unsigned short | ZLIB / default | 142.86 | 51.88 | 5.61 | 2.41 |
unsigned short | LZMA / default | 620.96 | 182.72 | 4.53 | 2.99 |
unsigned short | LZMA / 9 | 4621.88 | 144.56 | 3.76 | 3.61 |
unsigned char | ZLIB / default | 196.59 | 75.03 | 5.74 | 1.77 |
unsigned char | LZMA / default | 721.47 | 187.08 | 4.79 | 2.12 |
float | ZLIB / default | 302.71 | 86.95 | 8.04 | 3.37 |
double | ZLIB / default | 399.62 | 134.91 | 10.95 | 4.95 |
ROOT compression settings for feminos-daq output files. The calibration sample contained 52 194 events, with approximately 272 signals per event and 512 samples per signal. The branch compression factor refers to the waveform-sample branch in the event tree.Processing tests showed no measurable difference in the downstream conversion to REST-for-Physics for the compression settings considered here. The compression choice is therefore mainly an acquisition and storage decision: fast enough writing is required during calibration, while compact files are preferable for long background campaigns.
Online event viewer
REST-for-Physics provides a ROOT-based event viewer for visualizing events throughout the processing chain, from raw signals to processed events. However, it lacks the ability to visualize events in real time as they are being acquired by the data acquisition system. For this reason, feminos-daq includes a dedicated viewer for raw acquisition files.
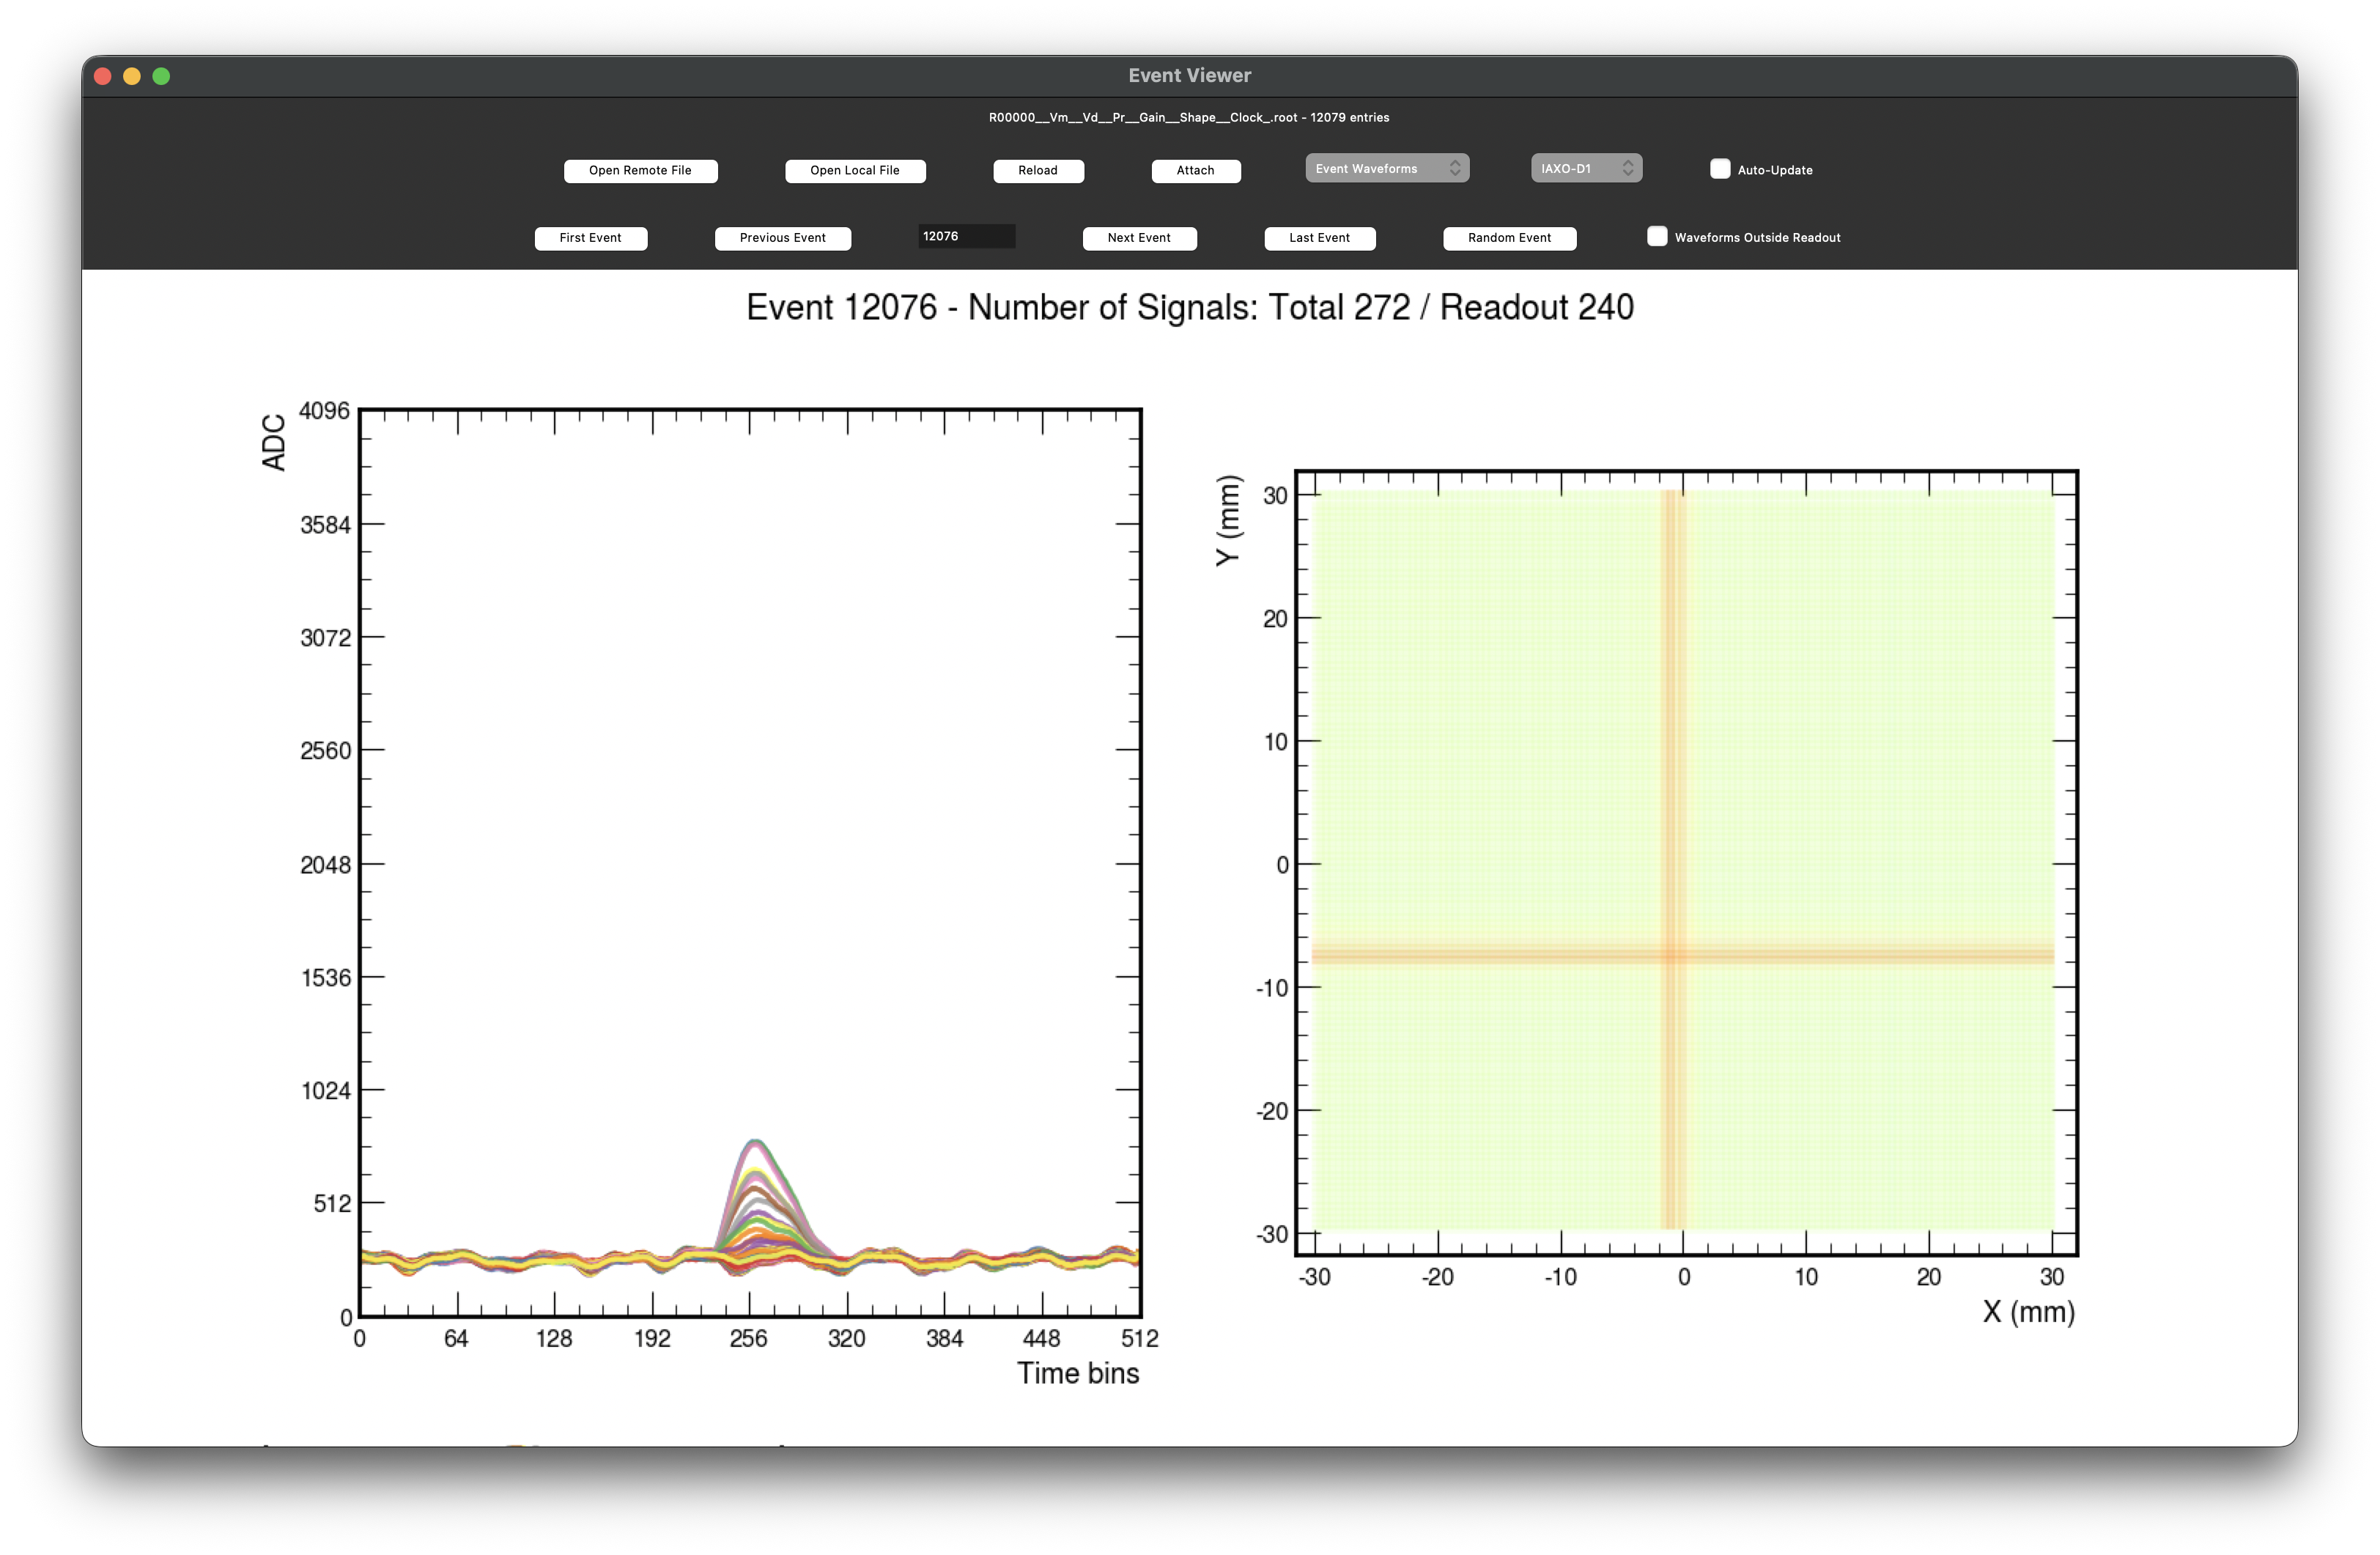
feminos-viewer application developed as part of the feminos-daq acquisition software. The left panel shows the raw FEMINOS waveforms for a single event, with individual readout channels colored according to their position in the detector. The right panel displays the corresponding hit map, showing the physical X/Y positions of the active readout channels for the selected event. The interface includes controls for navigating events, selecting readout mappings, and switching between waveform, activity, and observables views.A Python application, feminos-viewer, was developed to visualize raw data in real time as it is being acquired. It uses Uproot to read the ROOT file and Matplotlib to render waveforms. It can display events from closed files as well as from files that are still being written, either by opening a local or remote file or by attaching to the output of a running acquisition process. The viewer uses readout mappings to translate signal identifiers into physical detector coordinates and includes online observables such as channel activity and energy-like summaries.
feminos-viewer is complementary to the browser-based Geant4 event viewer: the former is an acquisition and waveform-quality monitoring tool, while the latter is a simulation and event-history tool. Both share the broader goal of making detector information inspectable without writing ad hoc analysis code for every diagnostic question. During data taking, feminos-viewer was used to identify detector and acquisition issues quickly, including malformed events, inactive or noisy channels, and inconsistencies between waveform activity and detector-coordinate mapping.
4.7.3 High-voltage control library: hvps
Stable Micromegas operation depends on the high-voltage system as much as on the gas and readout chains. The drift field, amplification field, current limits, ramping behavior, and trip-recovery policy must remain accessible during long background runs, and the relevant quantities should be readable by the same slow-control environment that supervises pressure, flow, temperature, and acquisition status. In practice, however, high-voltage power supplies expose device-specific serial protocols, with different command names, channel conventions, response formats, and status registers. This makes direct integration into detector-control software fragile if every dashboard or script sends raw vendor commands.
To address this problem, a dedicated high-voltage power-supply library, hvps, was developed during this thesis [100]. The package provides a common Python interface for serially controlled high-voltage supplies and currently supports CAEN and iseg devices. Its design follows the physical hierarchy of the instrument: an HVPS object manages the serial connection, a Module object represents the crate or board, and a Channel object exposes the monitor and control quantities associated with one output. Typical channel-level operations include reading the set and monitored voltages, reading the monitored current, switching a channel on or off, configuring ramp parameters, checking status words, and handling trip or interlock-related states. The purpose of the abstraction is not to hide the safety behavior of each device, but to make routine control actions explicit and reusable.
The library was also packaged as an operations tool rather than only as an importable module. A command-line interface allows operators and scripts to query or set high-voltage parameters from the terminal, while keeping the same validation and response-parsing layer used by the Python API. Bindings for Node.js and a Node-RED node were added so that the same backend could be used from web-based slow-control dashboards. This choice is directly connected to the IAXO detector-control model described in the Micromegas chapter: the high-voltage backend can be called from automation flows without duplicating low-level serial-command logic in the graphical interface. The repository also includes a graphical prototype for CAEN N1471H supplies, with real-time voltage and current monitoring, channel switching, alarm indicators, interlock information, and queued command execution to avoid simultaneous serial transactions.
From a software-engineering point of view, hvps occupies a different layer from feminos-daq. feminos-daq is responsible for event acquisition and online waveform inspection, whereas hvps belongs to detector operation and slow control. Both were developed with the same practical objective: reducing the number of ad hoc scripts needed to run and diagnose the detector, and replacing them with tested, version-controlled tools that can be reused in IAXO-D0, IAXO-D1, and future BabyIAXO-oriented setups. The package was released through PyPI, with corresponding Node.js/Node-RED packages distributed through npm, and includes tests for command construction, response parsing, and device-interface behavior. For the purposes of this thesis, its relevance is therefore not only that it can set a voltage, but that it makes high-voltage operation a reproducible software component of the detector system.
4.8 Monte Carlo production at scale
The background-model studies required large-scale Monte Carlo campaigns spanning multiple particle species, shielding configurations, and veto designs. This section describes the production infrastructure that made these campaigns feasible.
4.8.1 End-to-end simulation and analysis chain
Production simulations use the following sequence, with source-specific configurations and separately recorded normalization:
Source generation. Source terms are frozen independently of detector transport: the current studies use the Guan parameterization for muons, the HENSA-derived reference neutron spectrum with a separately specified angular model, and
CRYfor photons, electrons/positrons, protons, and generator cross-checks.restG4transport. The source histograms are sampled by the primary generator insiderestG4, and particles are transported through the IAXO detector geometry usingGeant4. The output is aTRestGeant4Eventstored in theEventTree.Detector response.
Geant4energy deposits are converted intoTRestDetectorHitsEventandTRestDetectorSignalEventrepresentations, where quenching, light attenuation, diffusion, and smearing are applied.Raw-signal emulation. Signals are converted to
TRestRawSignalEventthrough waveform shaping, sampling, trigger positioning, and dynamic-range effects.Reconstruction. Waveforms are reconstructed back into detector hits and tracks, yielding event representations directly comparable to experimental data.
AnalysisTreeobservables. Each processing stage appends scalar observables (hit multiplicities, energies, positions, veto peak times and amplitudes) to theAnalysisTree.Cuts and background-rate extraction. The observables are used to apply fiducial, topological, and energy cuts; surviving events are converted to background levels when the generated-primary denominator, source rate, and geometry have been validated.
This chain is configured through two RML files stored in the collaboration repository iaxo-simulations [101]: a source-specific simulation.rml and a common analysis.rml. This separation made it possible to treat source generation, transport, response emulation, and final selection as distinct but reproducible stages.
4.8.2 Production workflow with HTCondor
Simulations were orchestrated using HTCondor, a workload management system designed for High-Throughput Computing (HTC) [102]. Unlike traditional HPC environments that optimize for instantaneous floating-point performance, HTCondor maximizes total computational work over long periods through dynamic matchmaking between job requirements and available resources.
A dedicated Python script, restG4ToCondor.py, was developed to facilitate the submission of restG4 jobs to the HTCondor system. The script automates the creation of job description files and manages output data including log files, error reports, and the resulting ROOT files. Its command-line interface extends the restG4 interface, making it easy for users familiar with restG4 to adapt to batch submission.
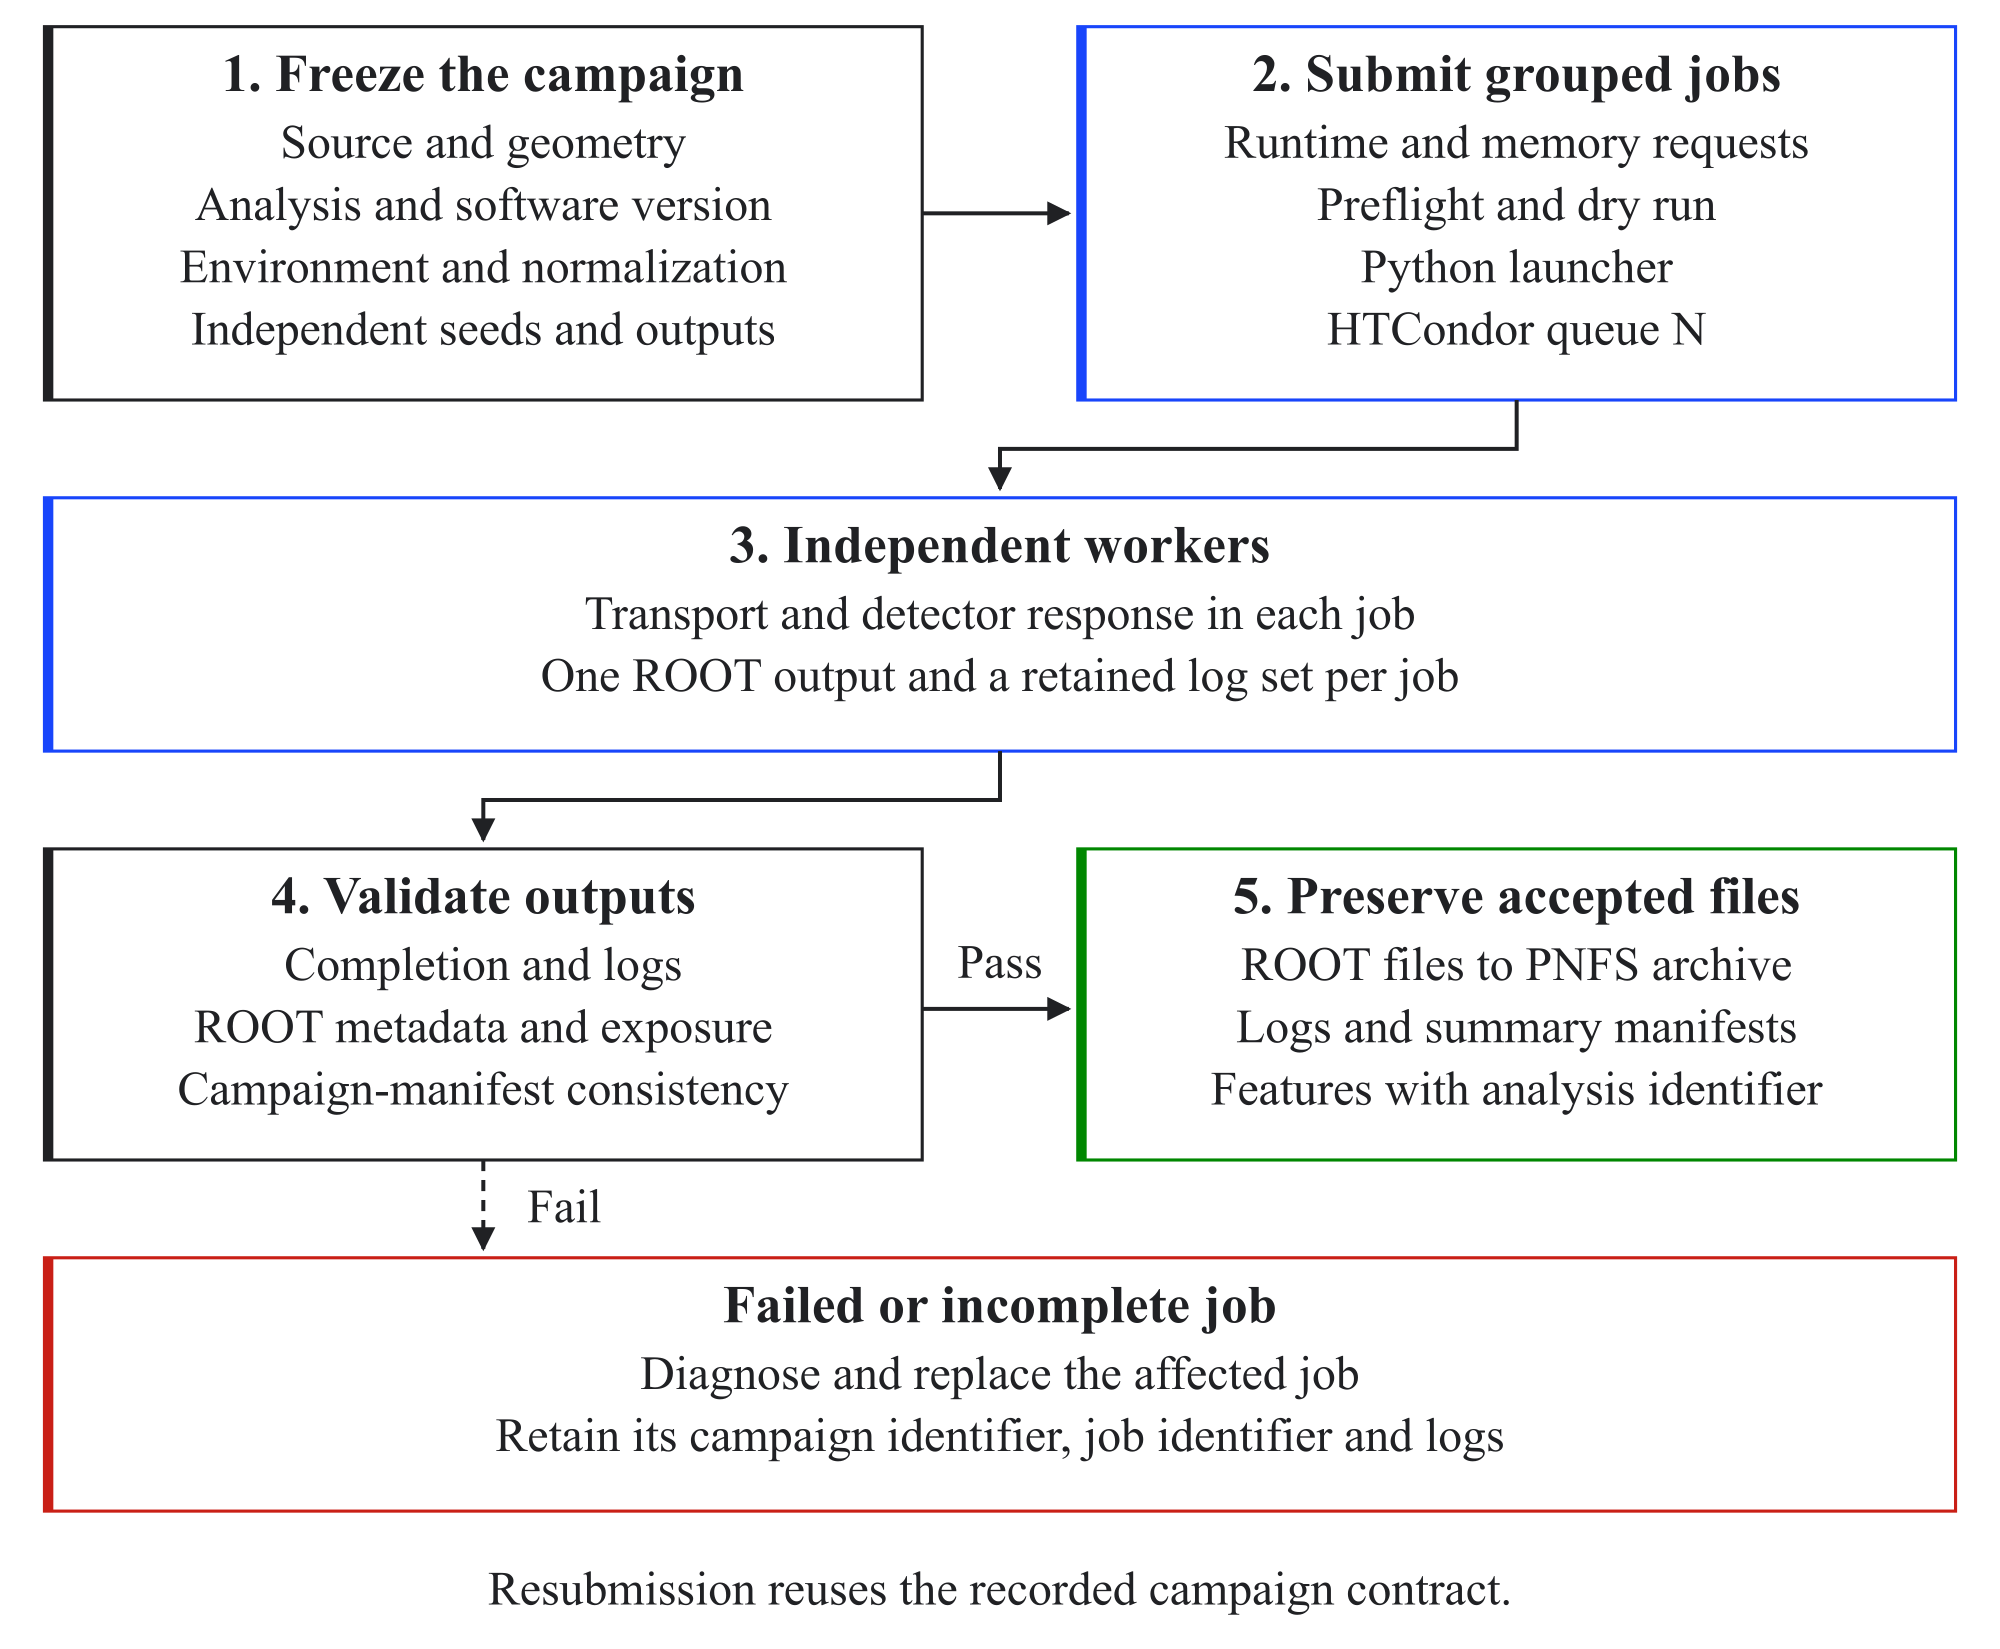
HTCondor workflow used for restG4 production. A frozen campaign contract is split into independent transport and response jobs. Outputs pass job, log, metadata, exposure, and manifest checks before they are merged or analyzed as grouped products; configuration, seeds, logs, and the accept/reject record remain linked to the resulting analysis identifier.Table 4.5 summarizes the typical workflow steps for a large Monte Carlo production campaign, from job splitting to the final extraction of analysis observables.
| Step | Action | Key configuration |
|---|---|---|
| Split / submit | restG4ToCondor.py splits the total number of events or time budget across independent jobs and submits them to HTCondor (optionally via DAGMan) | --n-jobs, --entries, --time |
| Simulate | Each job runs restG4 with the specified RML, geometry, source configuration, and environment variables | --rml, --geometry, --env |
| Process | restManager applies the analysis RML to the output of each simulation job | --rml-processing |
| Merge (optional) | restManager combines the processed outputs into a single file | --merge |
| Analyze | Observables from the AnalysisTree are extracted and used for cuts, efficiency studies, and background-rate calculations | Python / ROOT macros |
HTCondor production workflow steps.The multi-job productions used in this thesis were run on the National Analysis Facility (NAF) at DESY, referred to here as NAF-IAXO, which provides a centralized computing environment with dCache storage [103] and a HTCondor batch system. The initial validation campaign used approximately 600 jobs and produced about 40 000 saved cosmic-neutron and cosmic-muon events. The infrastructure was subsequently used for the substantially larger, source-specific campaigns whose generated-primary counts, equivalent exposures, and accepted files are recorded in Section 6 and its appendices.
4.8.3 Immutable analysis products and grouped evaluation
Large transport campaigns remain useful only if their physical and computational provenance can be recovered after the reconstruction or event selection changes. The final workflow developed in this thesis therefore treats the transport ROOT files, processed ROOT files, flat feature exports, and rate tables as different products rather than as interchangeable outputs. A complete campaign record stores the source RML, geometry, analysis configuration, relevant environment variables, software revision and local patches, random seed or job group, and input/output hashes. Preserved transport output can be reprocessed without repeating Geant4 only when it retains the physical information required by the revised response. Processed tracks alone cannot regenerate omitted waveforms or recoil steps. The processed response is therefore associated with the analysis identifier whose branches and cuts it actually implements.
This principle also applies to machine learning. Production file and campaign identifiers are preserved as grouping variables, so an event used in a reported rate can be scored by a fold model that did not train on that event or its production group. All delayed subevents and repeated response realizations from one parent history must remain in the same group; their reuse does not create independent transport trials. Threshold-calibration samples, untouched tests, and deployment artifacts are recorded separately. In the background-model application, the background-analysis-v1 artifacts preserve the topology-selector audit, while the machine-readable background-analysis-v2-conservative-reference contract and source-component registry govern physical normalization and final inclusion. The contract separates response compatibility from absolute normalization and from agreement with detector data. In particular, omitting the unvalidated learned topology selector does not remove the response dependence of the reconstructed energy, one-track requirement, or fiducial position. The source registry records these distinct requirements rather than treating a shared file format or selector name as evidence that all have been met.
4.9 geant4-python-application: Python prototyping with Geant4
geant4-python-application is a project developed during this thesis to make small Geant4 studies accessible from Python notebooks and scripts. It is a teaching and prototyping tool, not a replacement for the restG4 production pipeline.
The standard Geant4 workflow is based on user-written C++ applications. Although Python bindings and third-party Python interfaces exist, they do not provide the specific restG4-like, pip-installable, process-isolated application wrapper targeted here for notebooks, teaching, and rapid prototyping. The project wraps a generic user-configurable Geant4 application using Pybind11 to generate Python bindings. Repeated initialization was not reliable in the selected notebook-oriented wrapper, so process isolation was implemented with Python’s multiprocessing module. Each worker therefore runs an independent Geant4 instance without imposing a general limitation on the toolkit itself.
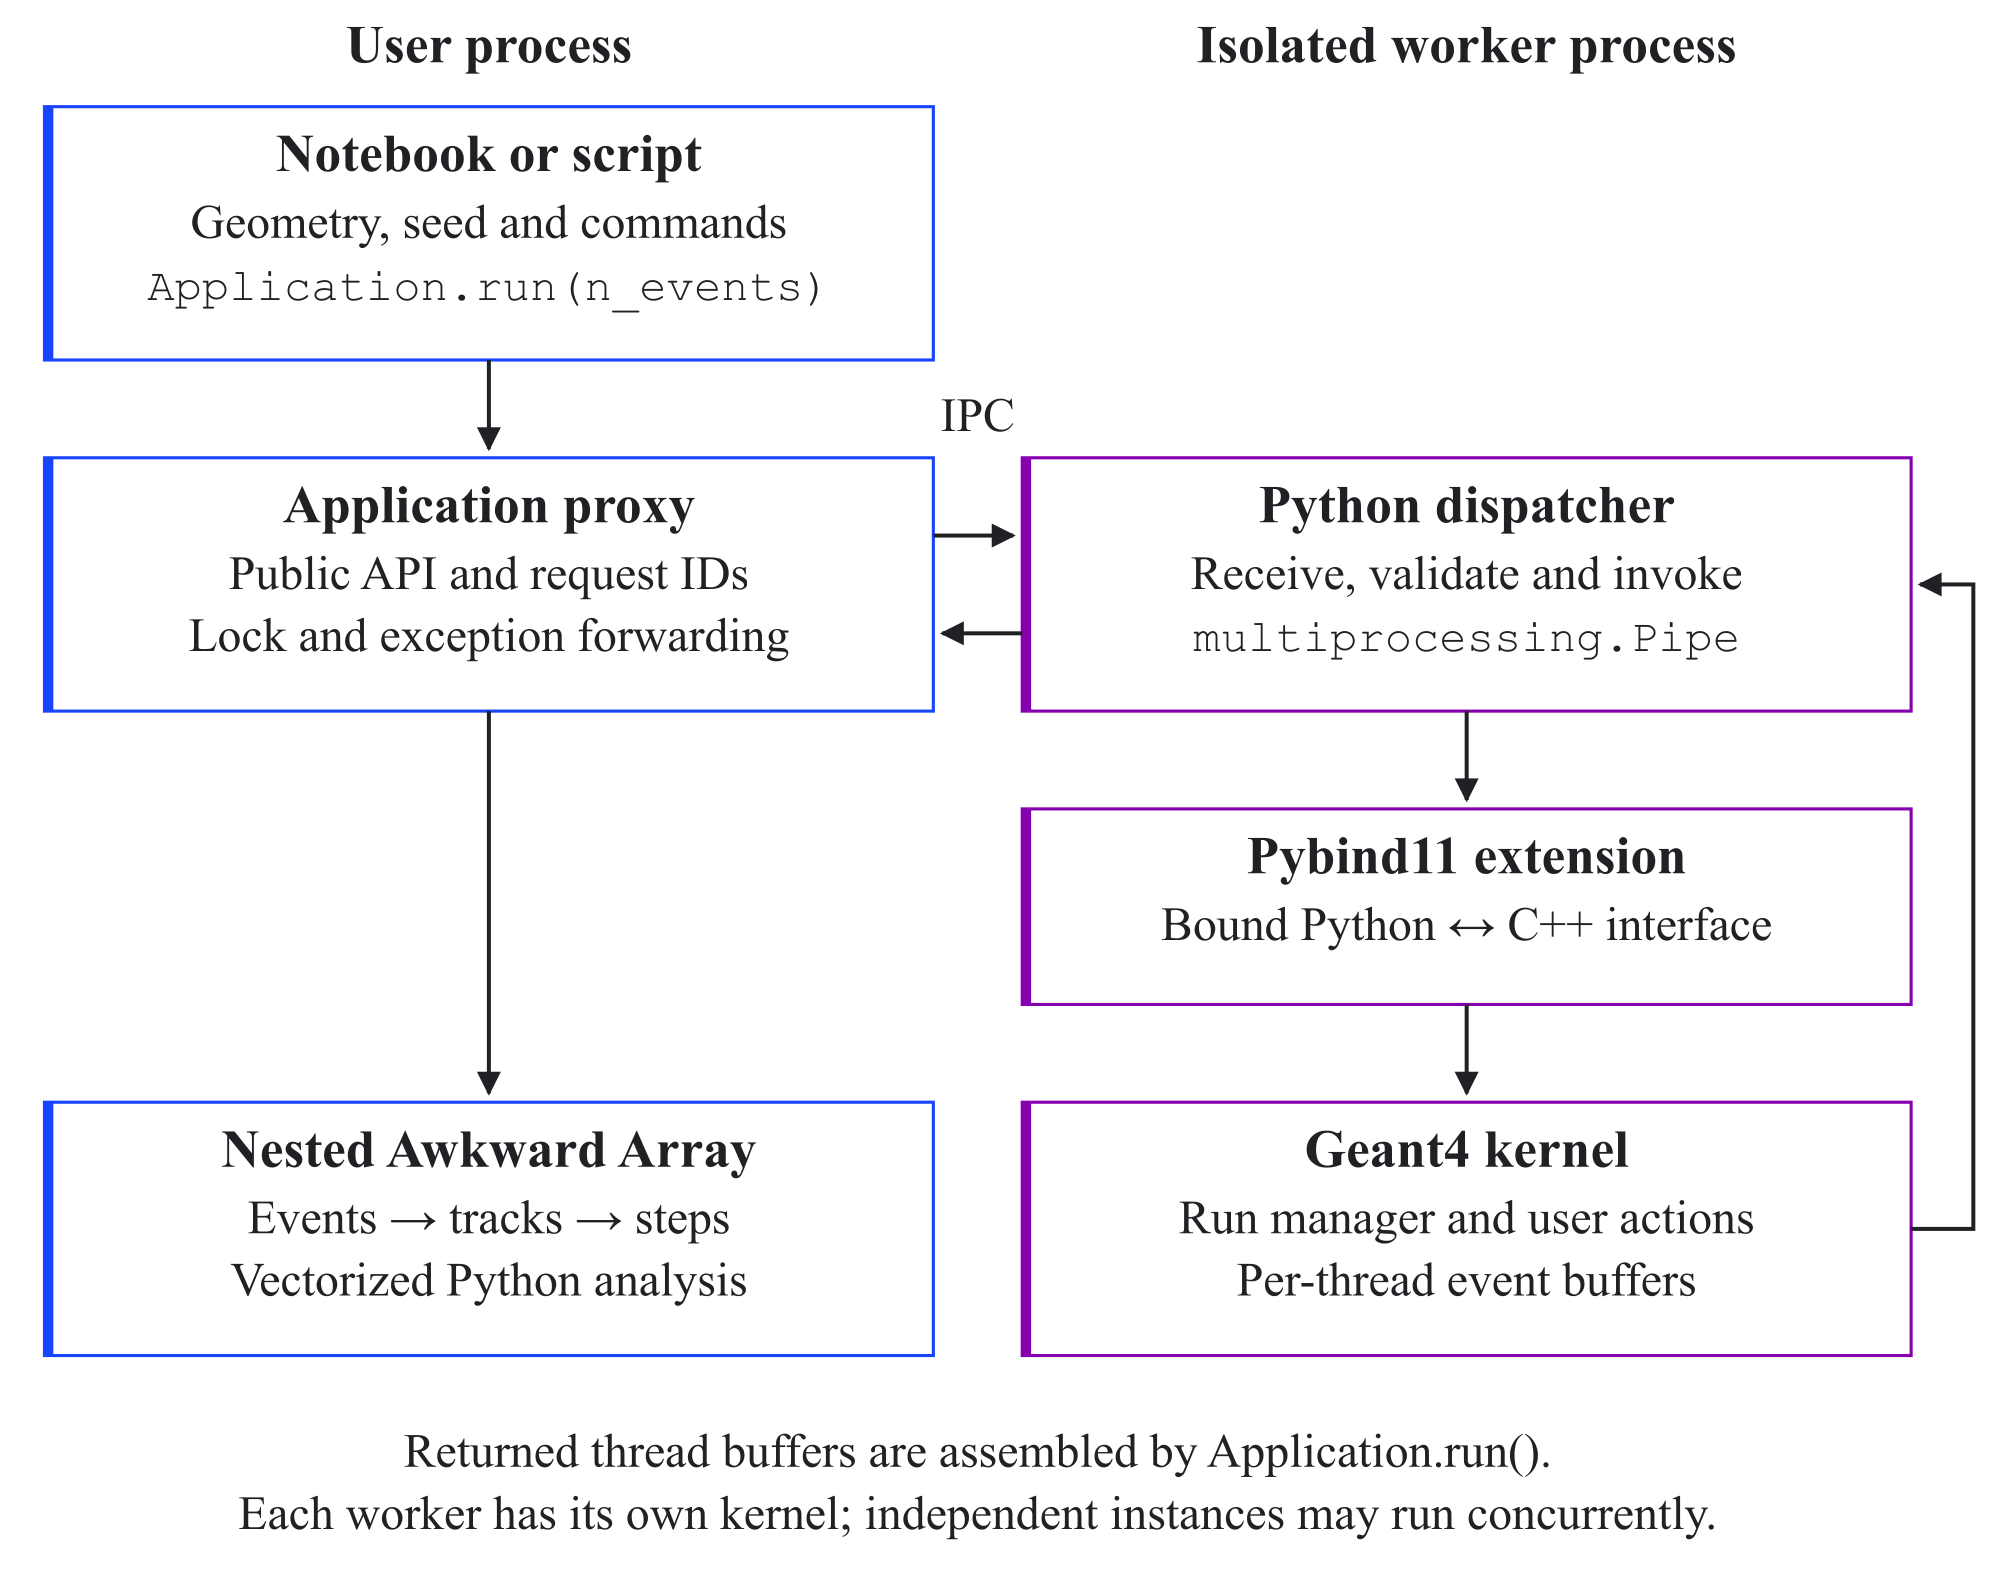
geant4-python-application project. The public Python proxy exchanges commands and per-thread event buffers with an independent worker through a duplex pipe; the worker invokes the Geant4 core through Pybind11, while Application.run() assembles the returned buffers into a nested Awkward Array.The following concrete outputs were demonstrated with this tool:
A Jupyter notebook computing the transmission of photons through lead in adaptive batches and analyzing the returned events with Awkward Array [92] (Figure 4.14).
Parallel execution through
Python’sconcurrent.futuresinterface, with each task launching an isolatedGeant4worker process rather than attempting to reinitializeGeant4inside a single process.Distribution as a pip-installable package on PyPI (
PythonPackage Index), with pre-compiled binary wheels for Linux, Windows, and macOS across multiplePythonversions, built via aGitHub ActionsCI pipeline.
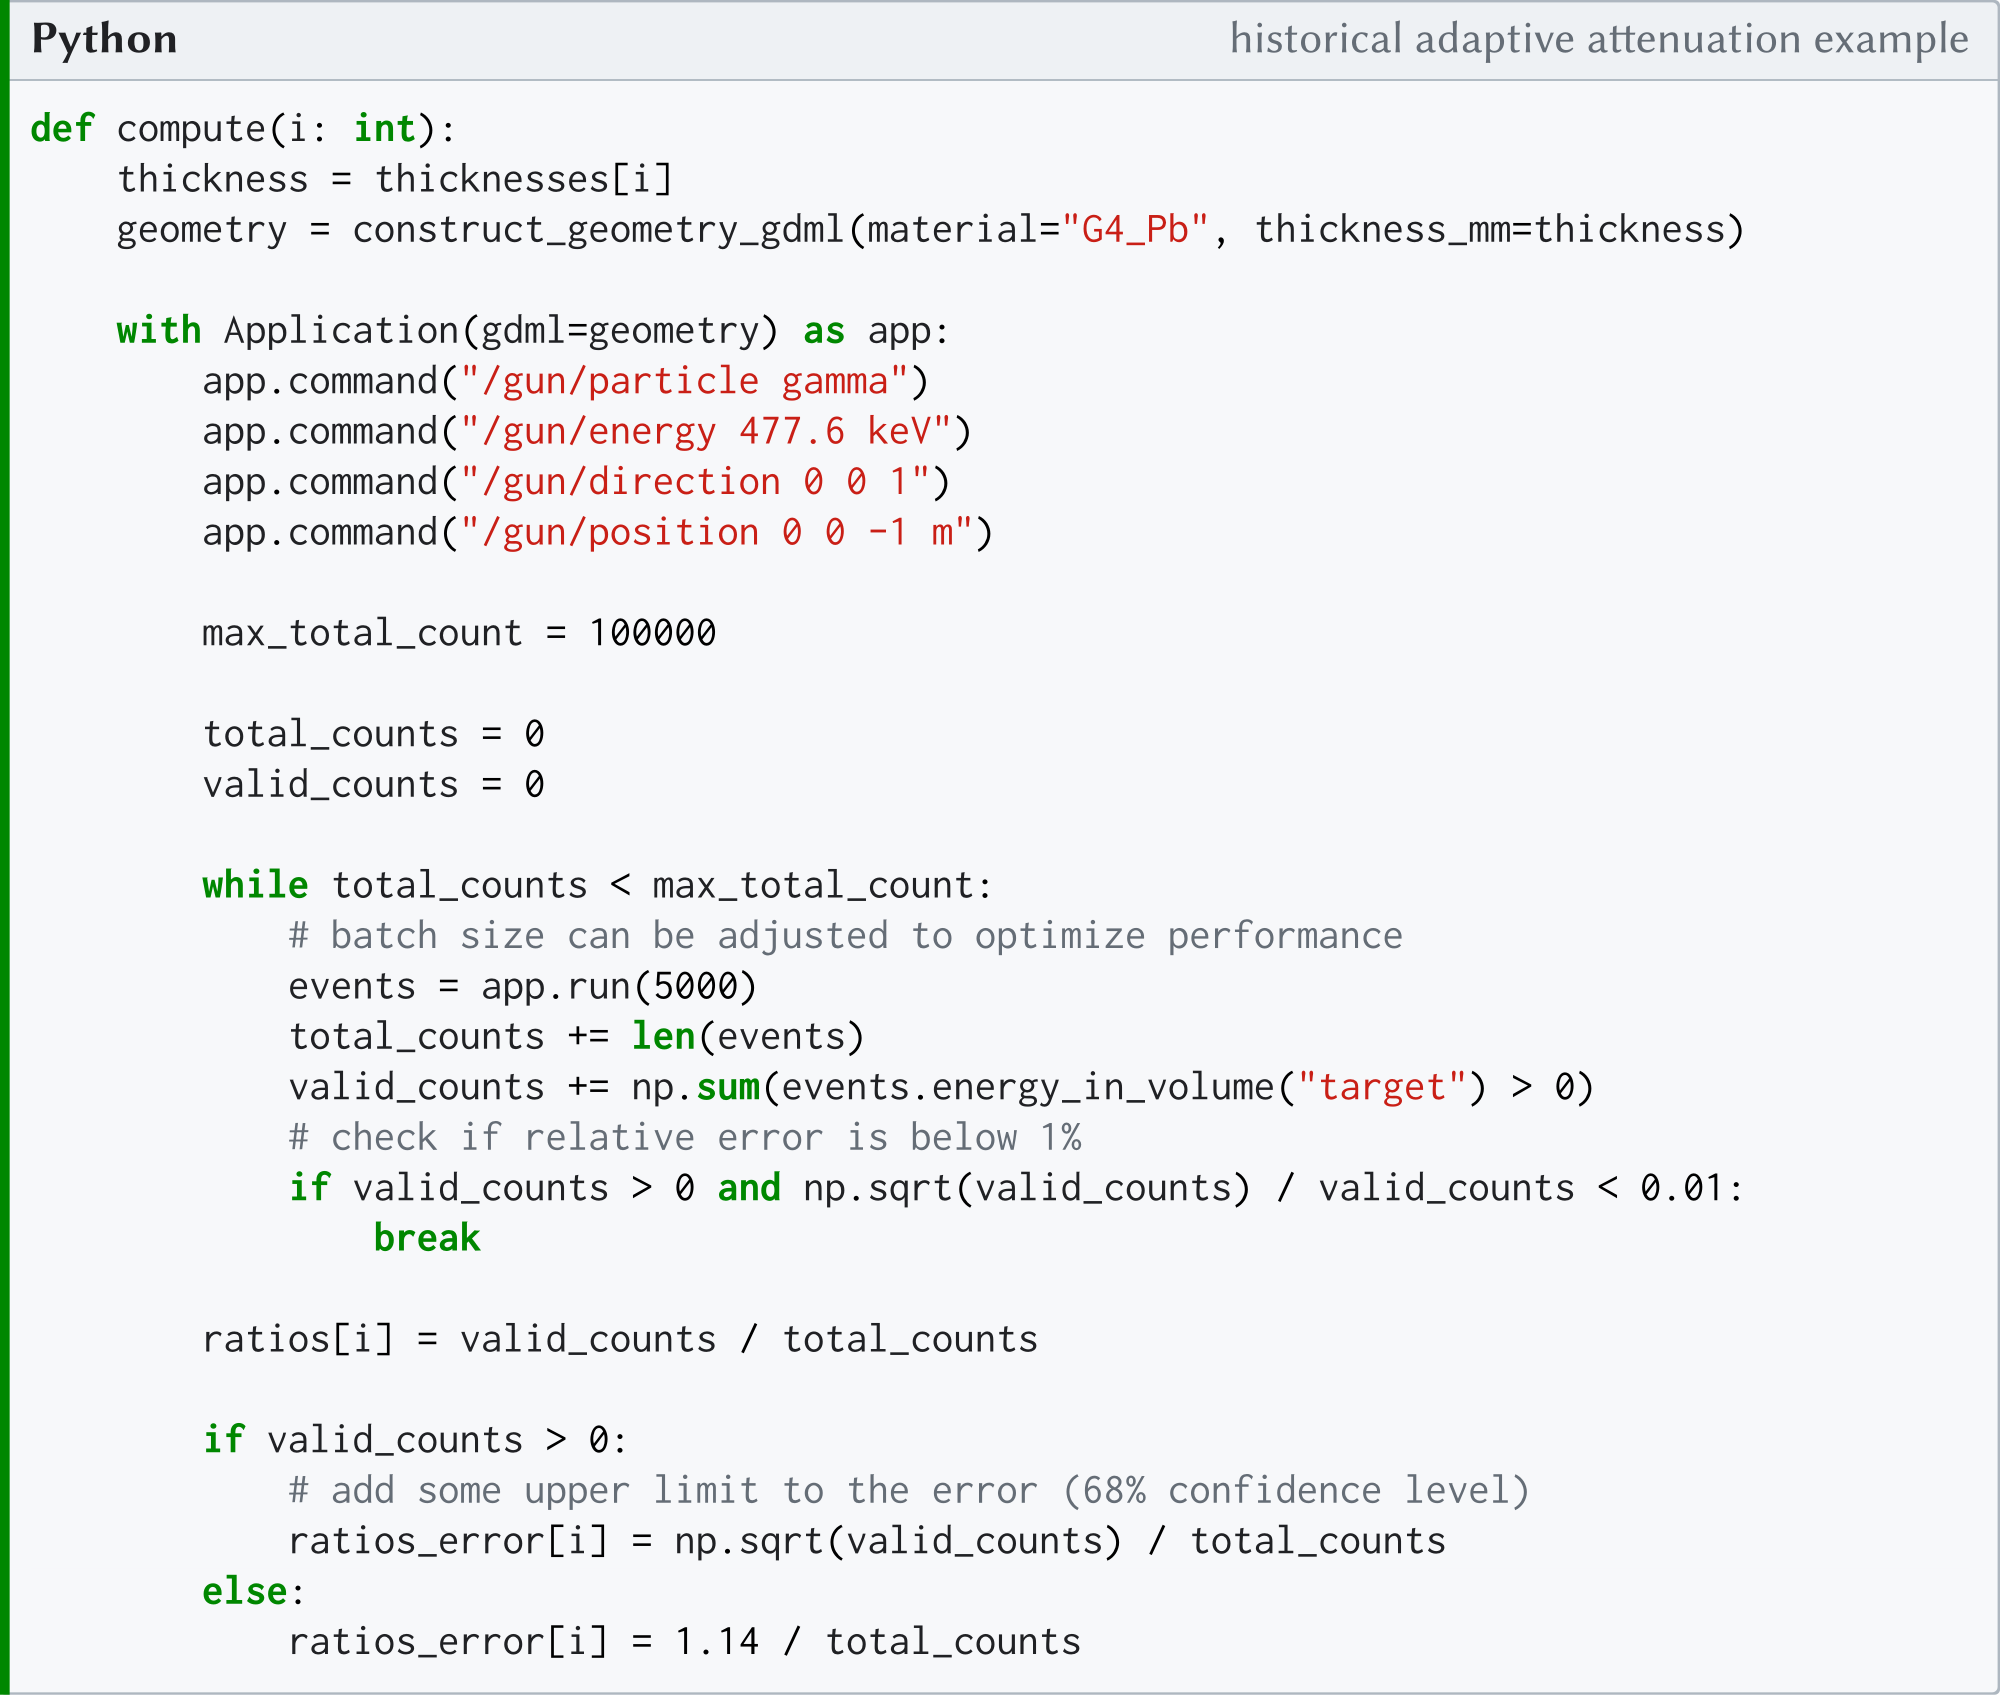
geant4-python-application photon-attenuation notebook, typeset from the original source. For each lead thickness, gamma rays are transported in batches of 5 000 events, up to a maximum of 100 000 events, with early stopping when the relative counting uncertainty, , falls below . Awkward Array operations determine the transmitted-event fraction; if no transmission is observed, the original notebook uses the large-sample one-sided 68% Poisson approximation . This historical example demonstrates adaptive execution, not a confidence construction validated for its stopping rule.For a fixed number of independent incident photons, the transmitted count is binomial. The usual standard-error estimate is , and the exact zero-transmission one-sided 68% bound is . The notebook’s Poisson expressions are rare-transmission approximations; repeated inspection and count-dependent stopping need a corresponding sequential procedure if confidence coverage is claimed [52]. The example was not used to normalize a production background result.
4.10 Summary and role in the thesis
The software contributions connect particle transport, readout geometry, reconstructed events, and physical source normalization within a common analysis workflow. Extensions to restG4 and Geant4Lib supplied multithreading, configurable track pruning, delayed-subevent handling, and geometry-name resolution. The published PDP method improved the efficiency of cosmic-particle injection, while the HTCondor tools made independently seeded campaigns and their output provenance manageable at the required scale.
Readout metadata and the browser event viewer provided complementary checks of the correspondence between sensitive volumes, electronic channels, and reconstructed signals. The DAQ, waveform viewer, and high-voltage tools supported detector operation, while the Uproot/fsspec contribution and Python interfaces made the same data accessible to interactive analysis and prototyping.
These tools provide the means to reproduce a calculation; the physical validity of a result still depends on its source definition, retained event information, detector response, and statistical denominator. Section 6 applies those requirements to the source inventory, and Section 5 tests the shielding and veto observables against simulation and prototype data.